longevity
Immune Resilience is Key to a Long and Healthy Life
Posted on by Lawrence Tabak, D.D.S., Ph.D.

Do you feel as if you or perhaps your family members are constantly coming down with illnesses that drag on longer than they should? Or, maybe you’re one of those lucky people who rarely becomes ill and, if you do, recovers faster than others.
It’s clear that some people generally are more susceptible to infectious illnesses, while others manage to stay healthier or bounce back more quickly, sometimes even into old age. Why is this? A new study from an NIH-supported team has an intriguing answer [1]. The difference, they suggest, may be explained in part by a new measure of immunity they call immune resilience—the ability of the immune system to rapidly launch attacks that defend effectively against infectious invaders and respond appropriately to other types of inflammatory stressors, including aging or other health conditions, and then quickly recover, while keeping potentially damaging inflammation under wraps.
The findings in the journal Nature Communications come from an international team led by Sunil Ahuja, University of Texas Health Science Center and the Department of Veterans Affairs Center for Personalized Medicine, both in San Antonio. To understand the role of immune resilience and its effect on longevity and health outcomes, the researchers looked at multiple other studies including healthy individuals and those with a range of health conditions that challenged their immune systems.
By looking at multiple studies in varied infectious and other contexts, they hoped to find clues as to why some people remain healthier even in the face of varied inflammatory stressors, ranging from mild to more severe. But to understand how immune resilience influences health outcomes, they first needed a way to measure or grade this immune attribute.
The researchers developed two methods for measuring immune resilience. The first metric, a laboratory test called immune health grades (IHGs), is a four-tier grading system that calculates the balance between infection-fighting CD8+ and CD4+ T-cells. IHG-I denotes the best balance tracking the highest level of resilience, and IHG-IV denotes the worst balance tracking the lowest level of immune resilience. An imbalance between the levels of these T cell types is observed in many people as they age, when they get sick, and in people with autoimmune diseases and other conditions.
The researchers also developed a second metric that looks for two patterns of expression of a select set of genes. One pattern associated with survival and the other with death. The survival-associated pattern is primarily related to immune competence, or the immune system’s ability to function swiftly and restore activities that encourage disease resistance. The mortality-associated genes are closely related to inflammation, a process through which the immune system eliminates pathogens and begins the healing process but that also underlies many disease states.
Their studies have shown that high expression of the survival-associated genes and lower expression of mortality-associated genes indicate optimal immune resilience, correlating with a longer lifespan. The opposite pattern indicates poor resilience and a greater risk of premature death. When both sets of genes are either low or high at the same time, immune resilience and mortality risks are more moderate.
In the newly reported study initiated in 2014, Ahuja and his colleagues set out to assess immune resilience in a collection of about 48,500 people, with or without various acute, repetitive, or chronic challenges to their immune systems. In an earlier study, the researchers showed that this novel way to measure immune status and resilience predicted hospitalization and mortality during acute COVID-19 across a wide age spectrum [2].
The investigators have analyzed stored blood samples and publicly available data representing people, many of whom were healthy volunteers, who had enrolled in different studies conducted in Africa, Europe, and North America. Volunteers ranged in age from 9 to 103 years. They also evaluated participants in the Framingham Heart Study, a long-term effort to identify common factors and characteristics that contribute to cardiovascular disease.
To examine people with a wide range of health challenges and associated stresses on their immune systems, the team also included participants who had influenza or COVID-19, and people living with HIV. They also included kidney transplant recipients, people with lifestyle factors that put them at high risk for sexually transmitted infections, and people who’d had sepsis, a condition in which the body has an extreme and life-threatening response following an infection.
The question in all these contexts was the same: How well did the two metrics of immune resilience predict an individual’s health outcomes and lifespan? The short answer is that immune resilience, longevity, and better health outcomes tracked together well. Those with metrics indicating optimal immune resilience generally had better health outcomes and lived longer than those who had lower scores on the immunity grading scale. Indeed, those with optimal immune resilience were more likely to:
- Live longer,
- Resist HIV infection or the progression from HIV to AIDS,
- Resist symptomatic influenza,
- Resist a recurrence of skin cancer after a kidney transplant,
- Survive COVID-19, and
- Survive sepsis.
The study also revealed other interesting findings. While immune resilience generally declines with age, some people maintain higher levels of immune resilience as they get older for reasons that aren’t yet known, according to the researchers. Some people also maintain higher levels of immune resilience despite the presence of inflammatory stress to their immune systems such as during HIV infection or acute COVID-19. People of all ages can show high or low immune resilience. The study also found that higher immune resilience is more common in females than it is in males.
The findings suggest that there is a lot more to learn about why people differ in their ability to preserve optimal immune resilience. With further research, it may be possible to develop treatments or other methods to encourage or restore immune resilience as a way of improving general health, according to the study team.
The researchers suggest it’s possible that one day checkups of a person’s immune resilience could help us to understand and predict an individual’s health status and risk for a wide range of health conditions. It could also help to identify those individuals who may be at a higher risk of poor outcomes when they do get sick and may need more aggressive treatment. Researchers may also consider immune resilience when designing vaccine clinical trials.
A more thorough understanding of immune resilience and discovery of ways to improve it may help to address important health disparities linked to differences in race, ethnicity, geography, and other factors. We know that healthy eating, exercising, and taking precautions to avoid getting sick foster good health and longevity; in the future, perhaps we’ll also consider how our immune resilience measures up and take steps to achieve or maintain a healthier, more balanced, immunity status.
References:
[1] Immune resilience despite inflammatory stress promotes longevity and favorable health outcomes including resistance to infection. Ahuja SK, Manoharan MS, Lee GC, McKinnon LR, Meunier JA, Steri M, Harper N, Fiorillo E, Smith AM, Restrepo MI, Branum AP, Bottomley MJ, Orrù V, Jimenez F, Carrillo A, Pandranki L, Winter CA, Winter LA, Gaitan AA, Moreira AG, Walter EA, Silvestri G, King CL, Zheng YT, Zheng HY, Kimani J, Blake Ball T, Plummer FA, Fowke KR, Harden PN, Wood KJ, Ferris MT, Lund JM, Heise MT, Garrett N, Canady KR, Abdool Karim SS, Little SJ, Gianella S, Smith DM, Letendre S, Richman DD, Cucca F, Trinh H, Sanchez-Reilly S, Hecht JM, Cadena Zuluaga JA, Anzueto A, Pugh JA; South Texas Veterans Health Care System COVID-19 team; Agan BK, Root-Bernstein R, Clark RA, Okulicz JF, He W. Nat Commun. 2023 Jun 13;14(1):3286. doi: 10.1038/s41467-023-38238-6. PMID: 37311745.
[2] Immunologic resilience and COVID-19 survival advantage. Lee GC, Restrepo MI, Harper N, Manoharan MS, Smith AM, Meunier JA, Sanchez-Reilly S, Ehsan A, Branum AP, Winter C, Winter L, Jimenez F, Pandranki L, Carrillo A, Perez GL, Anzueto A, Trinh H, Lee M, Hecht JM, Martinez-Vargas C, Sehgal RT, Cadena J, Walter EA, Oakman K, Benavides R, Pugh JA; South Texas Veterans Health Care System COVID-19 Team; Letendre S, Steri M, Orrù V, Fiorillo E, Cucca F, Moreira AG, Zhang N, Leadbetter E, Agan BK, Richman DD, He W, Clark RA, Okulicz JF, Ahuja SK. J Allergy Clin Immunol. 2021 Nov;148(5):1176-1191. doi: 10.1016/j.jaci.2021.08.021. Epub 2021 Sep 8. PMID: 34508765; PMCID: PMC8425719.
Links:
COVID-19 Research (NIH)
HIV Info (NIH)
Sepsis (National Institute of General Medical Sciences/NIH)
Sunil Ahuja (University of Texas Health Science Center, San Antonio)
Framingham Heart Study (National Heart, Lung, and Blood Institute/NIH)
“A Secret to Health and Long Life? Immune Resilience, NIAID Grantees Report,” NIAID Now Blog, June 13, 2023
NIH Support: National Institute of Allergy and Infectious Diseases; National Institute on Aging; National Institute of Mental Health; National Institute of General Medical Sciences; National Heart, Lung, and Blood Institute
NIH Collaboration Seeks to Help Understand U.S. Burden of Health Disparities: Why Your County Matters
Posted on by Eliseo J. Pérez-Stable, M.D., National Institute on Minority Health and Health Disparities

Since the early 1990s, federal support of research has increased to understand minority health and identify and address health disparities. Research in these areas has evolved from a starting point of developing a basic descriptive understanding of health disparities and who is most affected. Now, it is discovering the underlying complexity of factors involved in health outcomes to inform interventions and reduce these disparities.
One of these many factors is where we live, learn, work, and play and how that affects different people. A group of NIH scientists and their colleagues recently published a study in the journal The Lancet that they hope is a step toward better understanding geographic disparities and their role in health equity [1].

As Director of NIH’s National Institute on Minority Health and Health Disparities (NIMHD), I worked with NIMHD’s Scientific Director, Anna María Nápoles, to conceive the study and establish the Global Burden of Disease (GBD) U.S. Health Disparities Collaborators at NIH with five NIH Institutes and two Offices. Through this collaboration, NIH funded the Institute for Health Metrics and Evaluation (IHME), University of Washington to conduct the analysis. The IHME has worked for 30 years on the GBD project in over 200 countries.
The Lancet paper offered the first comprehensive U.S. county-level life expectancy estimates to highlight the significant gaps that persist among racial and ethnic populations across the nation. The analysis revealed that despite overall life expectancy gains of 2.3 years from 2000–2019, Black populations experienced shorter life expectancy than White populations.
In addition, American Indian and Alaska Native populations’ life expectancy did not improve and, in fact, decreased in most counties. We found national-level life expectancy advantages for Hispanic/Latino and Asian populations ranging from three to seven years, respectively, compared to White populations. But there were notable exceptions for Hispanic/Latino populations in selected counties in the Southwest.
Certainly the most-alarming trend identified in the paper was that during the study’s last 10 years (2010–2019), life expectancy growth was stagnant across all races and ethnicities. Moreover, 60 percent of U.S. counties experienced a decrease in life expectancy.
While these findings provide an important frame for how disparities exist along many dimensions—by race, ethnicity, and geographic region—they also highlight these differences within our local communities. This level of detail offers an unprecedented opportunity for researchers and public health leaders to focus on where these differences are the most prominent, and possibly give us a clearer picture on what can be done about it.
These data raise many important questions, too. What can we learn from places that are doing well in caring for their most disadvantaged populations? How can these factors be sustained, replicated, and transferred to other places? Are there current policies and/or community services that contribute to or inhibit gaining access to appropriate clinical care, healthy and affordable food, good schools, and/or economic opportunities?
To help answer these questions, the GBD U.S. Health Disparities Collaborators at NIH, in partnership with IHME, have developed a comprehensive database and interactive data visualization tool that provides life expectancy and all-cause mortality by race and ethnicity for 3,110 U.S. counties from 2000-2019. Efforts are underway to expand the database to include causes of death and risk factors by race/ethnicity and education, as well as to disaggregate some of the major racial-ethnic groups.
Using IHME’s established model of comprehensive and replicable data collection, the joint effort aims to improve access to health data resources, bolster analytic approaches, and deliver user-friendly estimates to the wider research and health policy community. The collection’s standardized, comprehensive, historical, and real-time data can be the cornerstone for efforts to address disparities and advance health equity.
It is important to note that the Lancet study only included data from before the COVID-19 pandemic. The pandemic’s disproportionate effect on overall mortality and life expectancy has exacerbated existing health disparities. Disaggregated data are essential in helping to understand the underlying mechanisms of health disparities and guiding the development and implementation of interventions that address local needs.
As a clinician scientist, I have made a personal commitment at NIMHD to foster and encourage data collection with standardized measures, harmonization, and efficient data sharing to help us explore the nuances within all populations and their communities. Without these guiding principles for managing data, inequities remain unseen and unaddressed. Scientists, clinicians, and policymakers can all potentially benefit from this work if we use the data to inform our actions. It is an opportunity to implement real change in our NIH-wide combined efforts to reduce health disparities and improve quality of life and longevity for all populations.
Reference:
[1] Life expectancy by county, race, and ethnicity in the USA, 2000-19: a systematic analysis of health disparities. GBD US Health Disparities Collaborators. Lancet. 2022 Jul 2;400(10345):25-38.
Links:
Understand Health Disparities Series (National Institute on Minority Health and Health Disparities/NIH)
HD Pulse (NIMHD)
PhenX Social Determinants of Health Toolkit (NIMHD)
Institute for Health Metrics (University of Washington, Seattle)
NIH Support: The members of the GBD U.S. Health Disparities Collaborators at NIH include: National Heart, Lung, and Blood Institute; National Cancer Institute; National Institute on Aging; National Institute of Arthritis and Musculoskeletal and Skin Diseases; NIH Office of Disease Prevention; NIH Office of Behavioral and Social Science Research
Note: Dr. Lawrence Tabak, who performs the duties of the NIH Director, has asked the heads of NIH’s Institutes and Centers (ICs) to contribute occasional guest posts to the blog to highlight some of the interesting science that they support and conduct. This is the 17th in the series of NIH IC guest posts that will run until a new permanent NIH director is in place.
New Evidence Suggests Aging Brains Continue to Make New Neurons
Posted on by Dr. Francis Collins
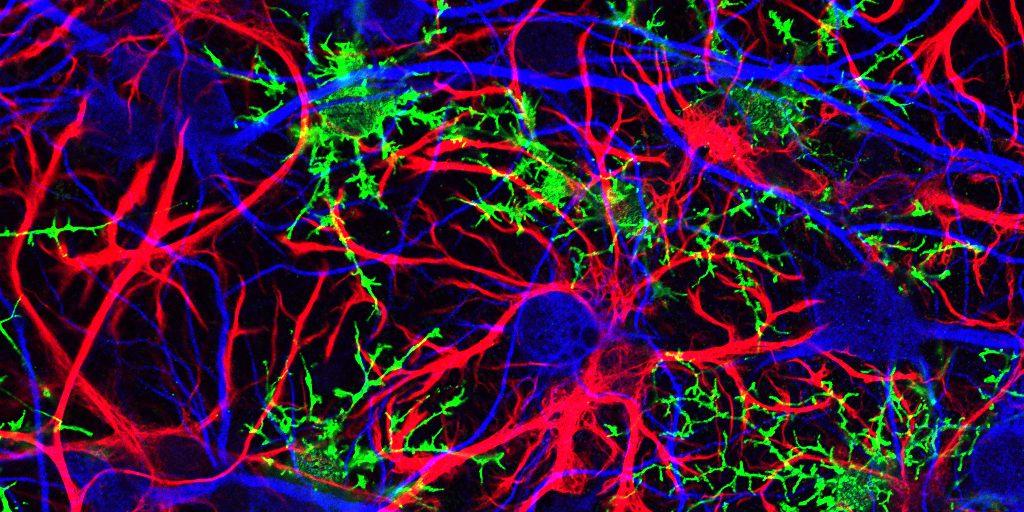
Caption: Mammalian hippocampal tissue. Immunofluorescence microscopy showing neurons (blue) interacting with neural astrocytes (red) and oligodendrocytes (green).
Credit: Jonathan Cohen, Fields Lab, Eunice Kennedy Shriver National Institute of Child Health and Human Development, NIH
There’s been considerable debate about whether the human brain has the capacity to make new neurons into adulthood. Now, a recently published study offers some compelling new evidence that’s the case. In fact, the latest findings suggest that a healthy person in his or her seventies may have about as many young neurons in a portion of the brain essential for learning and memory as a teenager does.
As reported in the journal Cell Stem Cell, researchers examined the brains of healthy people, aged 14 to 79, and found similar numbers of young neurons throughout adulthood [1]. Those young neurons persisted in older brains that showed other signs of decline, including a reduced ability to produce new blood vessels and form new neural connections. The researchers also found a smaller reserve of quiescent, or inactive, neural stem cells in a brain area known to support cognitive-emotional resilience, the ability to cope with and bounce back from stressful circumstances.
While more study is clearly needed, the findings suggest healthy elderly people may have more cognitive reserve than is commonly believed. However, the findings may also help to explain why even perfectly healthy older people often find it difficult to face new challenges, such as travel or even shopping at a different grocery store, that wouldn’t have fazed them earlier in life.
Crowdsourcing 600 Years of Human History
Posted on by Dr. Francis Collins
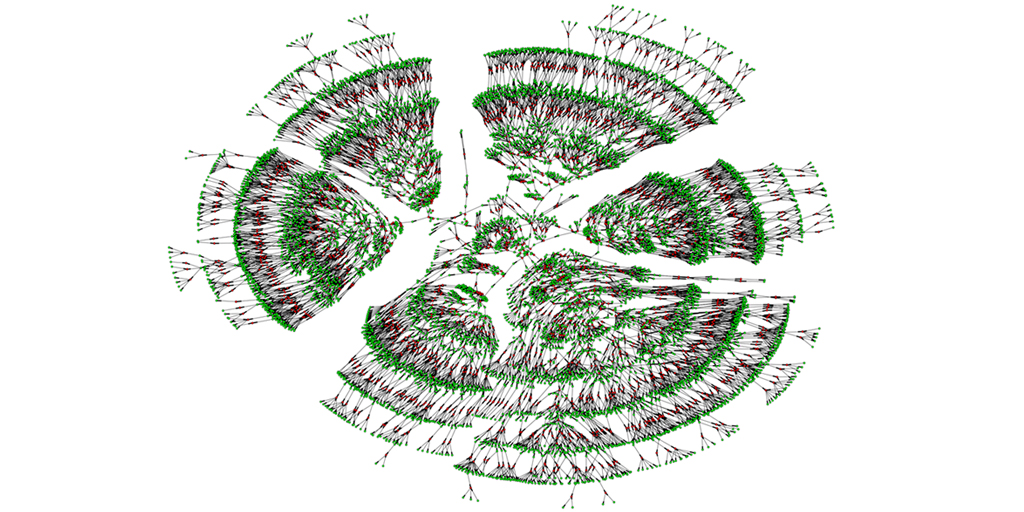
Caption: A 6,000-person family tree, showing individuals spanning seven generations (green) and their marital links (red).
Credit: Columbia University, New York City
You may have worked on constructing your family tree, perhaps listing your ancestry back to your great-grandparents. Or with so many public records now available online, you may have even uncovered enough information to discover some unexpected long-lost relatives. Or maybe you’ve even submitted a DNA sample to one of the commercial sources to see what you could learn about your ancestry. But just how big can a family tree grow using today’s genealogical tools?
A recent paper offers a truly eye-opening answer. With permission to download the publicly available, online profiles of 86 million genealogy hobbyists, most of European descent, the researchers assembled more than 5 million family trees. The largest totaled more than 13 million people! By merging each tree from the crowd-sourced and public data, including the relatively modest 6,000-person seedling shown above, the researchers were able to go back 11 generations on average to the 15th century and the days of Christopher Columbus. Doubly exciting, these large datasets offer a powerful new resource to study human health, having already provided some novel insights into our family structures, genes, and longevity.
Widening Gap in U.S. Life Expectancy
Posted on by Dr. Francis Collins
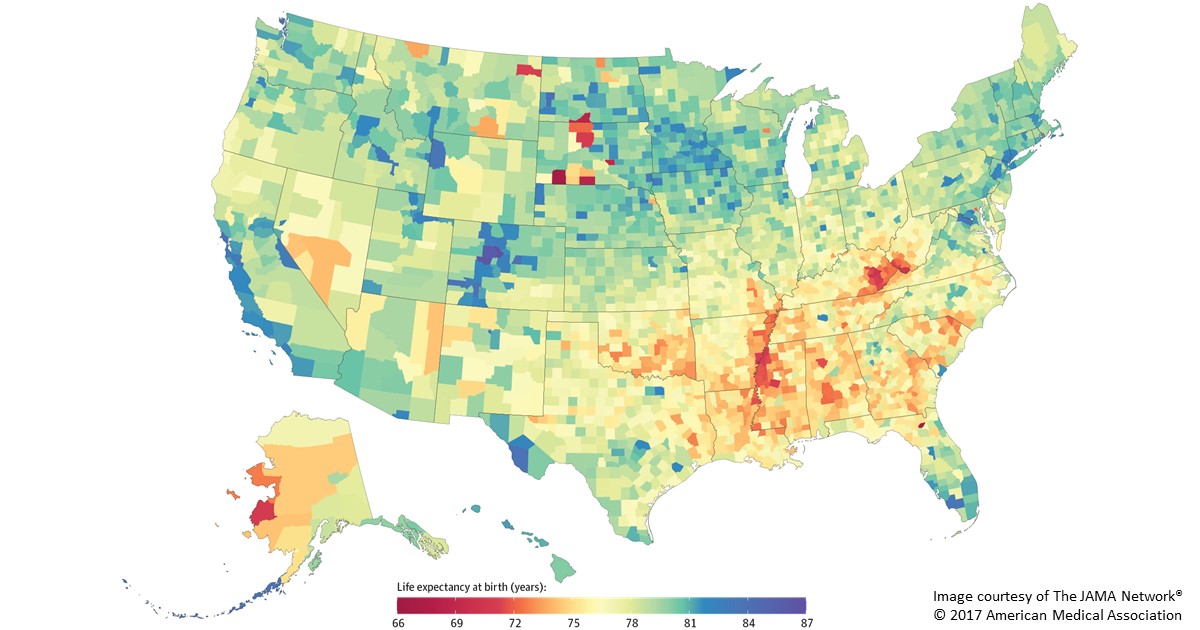
Caption: Life expectancy at birth by county, 2014. Life expectancy into 80s (blue), 70s (green, yellow, orange), 60s (red).
Americans are living longer than ever before, thanks in large part to NIH-supported research. But a new, heavily publicized study shows that recent gains in longevity aren’t being enjoyed equally in all corners of the United States. In fact, depending on where you live in this great country, life expectancy can vary more than 20 years—a surprisingly wide gap that has widened significantly in recent decades.
Researchers attribute this disturbing gap to a variety of social and economic influences, as well as differences in modifiable behavioral and lifestyle factors, such as obesity, inactivity, and tobacco use. The findings serve as a sobering reminder that, despite the considerable progress made possible by biomedical science, more research is needed to figure out better ways of addressing health disparities and improving life expectancy for all Americans.
In the new study published in JAMA Internal Medicine, a research team, partially funded by NIH, found that the average American baby born in 2014 can expect to live to about age 79 [1]. That’s up from a national average of about 73 in 1980 and around 68 in 1950. However, babies born in 2014 in remote Oglala Lakota County, SD, home to the Pine Ridge Indian Reservation, can expect to live only about 66 years. That’s in stark contrast to a child born about 400 miles away in Summit County, CO, where life expectancy at birth now exceeds age 86.
Happy New Year: Looking Back at 2016 Research Highlights
Posted on by Dr. Francis Collins
 Happy New Year! While everyone was busy getting ready for the holidays, the journal Science announced its annual compendium of scientific Breakthroughs of the Year. If you missed it, the winner for 2016 was the detection of gravitational waves—tiny ripples in the fabric of spacetime created by the collision of two black holes 1.3 billion years ago! It’s an incredible discovery, and one that Albert Einstein predicted a century ago.
Among the nine other advances that made the first cut for Breakthrough of the Year, several involved the biomedical sciences. As I’ve done in previous years (here and here), I’ll kick off this New Year by taking a quick look of some of the breakthroughs that directly involved NIH support:
Creative Minds: A New Chemistry for Aging Research?
Posted on by Dr. Francis Collins

Tony Wyss-Coray / Credit: Stanford School of Medicine
Basic scientists have long studied aging by looking inside of cells. While this research has produced many important leads, they are now starting to look outside the cell for the wealth of biochemical clues contained in the bloodstream.
To introduce you to this exciting frontier in aging research, this blog highlighted a while back the work of Tony Wyss-Coray at Stanford School of Medicine, Palo Alto, CA. He and a colleague had just received a 2013 NIH Director’s Transformative Research Award to explore the effects of exercise on the brains of mice. Their work, in fact, produced one of Science Magazine’s Breakthrough Discoveries of 2014. Their team showed that by fusing the circulatory systems of old and young mice to create a shared blood supply, the young blood triggered new muscle and neural connections in the older mice, while also improving their memories.
As fascinating as this theoretical Fountain of Youth was, Wyss-Coray recognized a critical limitation. He had no way of knowing how factors secreted by the young mouse could actually cross the blood-brain barrier and rejuvenate neurons. To solve this unknown, Wyss-Coray recently received a 2015 NIH Director’s Pioneer Award to build a potentially game-changing tool to track the aging process in mice.
Revisiting Resveratrol’s Health Claims
Posted on by Dr. Francis Collins

Over the past decade or so, a lot of us have been led to believe that certain indulgences—such as a glass of Pinot noir or a piece of dark chocolate—can actually be health-promoting. That’s because a number of studies had suggested that red wine, chocolate, and other foods containing the antioxidant resveratrol might lower the risk of heart disease, cancer, and other age-related maladies. But now comes word that a diet rich in resveratrol may not automatically translate into better health.
Creative Minds: Path to Longevity May Start With … Bats and Mole Rats!
Posted on by Dr. Francis Collins

Caption: DNA studies are unraveling the secrets of these mammals (clockwise from top left): naked mole rat, bowhead whale, and Brandt’s bat.
Credit: Clockwise from top left: Smithsonian’s National Zoo; National Oceanic and Atmospheric Administration; Vadim Gladyshev; National Human Genome Genome Research Institute, NIH
It started simply, with the analysis of a trace element in proteins. It led, through recognizing and following provocative patterns, to one of humanity’s greatest questions: what is the secret to a long life?
This intriguing scientific path, traveled by NIH Pioneer Awardee Vadim Gladyshev, has brought together an assortment of mammals, great and small. It has relied upon a veritable global treasure-hunt, with samples from Russian caves, East African tunnels, and Arctic oceans. It was Gladyshev’s scientific acumen that mapped this path. And it is comparative genomic analysis that provided the vehicle he has used to travel along it – right up to the threshold of new insights into healthier, longer life.
Secrets of a Supercentenarian’s Genome
Posted on by Dr. Francis Collins

Caption: Hendrikje van Andel-Schipper (2nd from the left) in her youth. She was born June 29, 1890, premature and so tiny that no one thought she would survive. However, she lived to be 115.
Credit: Ramon Schipper
Not too long before 115-year-old Hendrikje “Hennie” van Andel-Schipper died in 2005, this Dutch “supercentenarian” attributed her remarkable longevity to eating raw salted herring, to drinking orange juice, and—with a twinkle in her eye—“to breathing.”
Because very few humans have survived as long Hennie, it’s only logical to ask whether some of the secrets to her impressive lifespan might lie in her genes. And we find ourselves in a great position to explore such questions, thanks to the convergence of two things: recent advances in DNA sequencing technology, and Hennie’s generous decision, made when she was a mere 82 years old, to donate her body to science upon her death.
Next Page