Snapshots of Life
The Amazing Brain: Turning Conventional Wisdom on Brain Anatomy on its Head
Posted on by John Ngai, PhD, NIH BRAIN Initiative
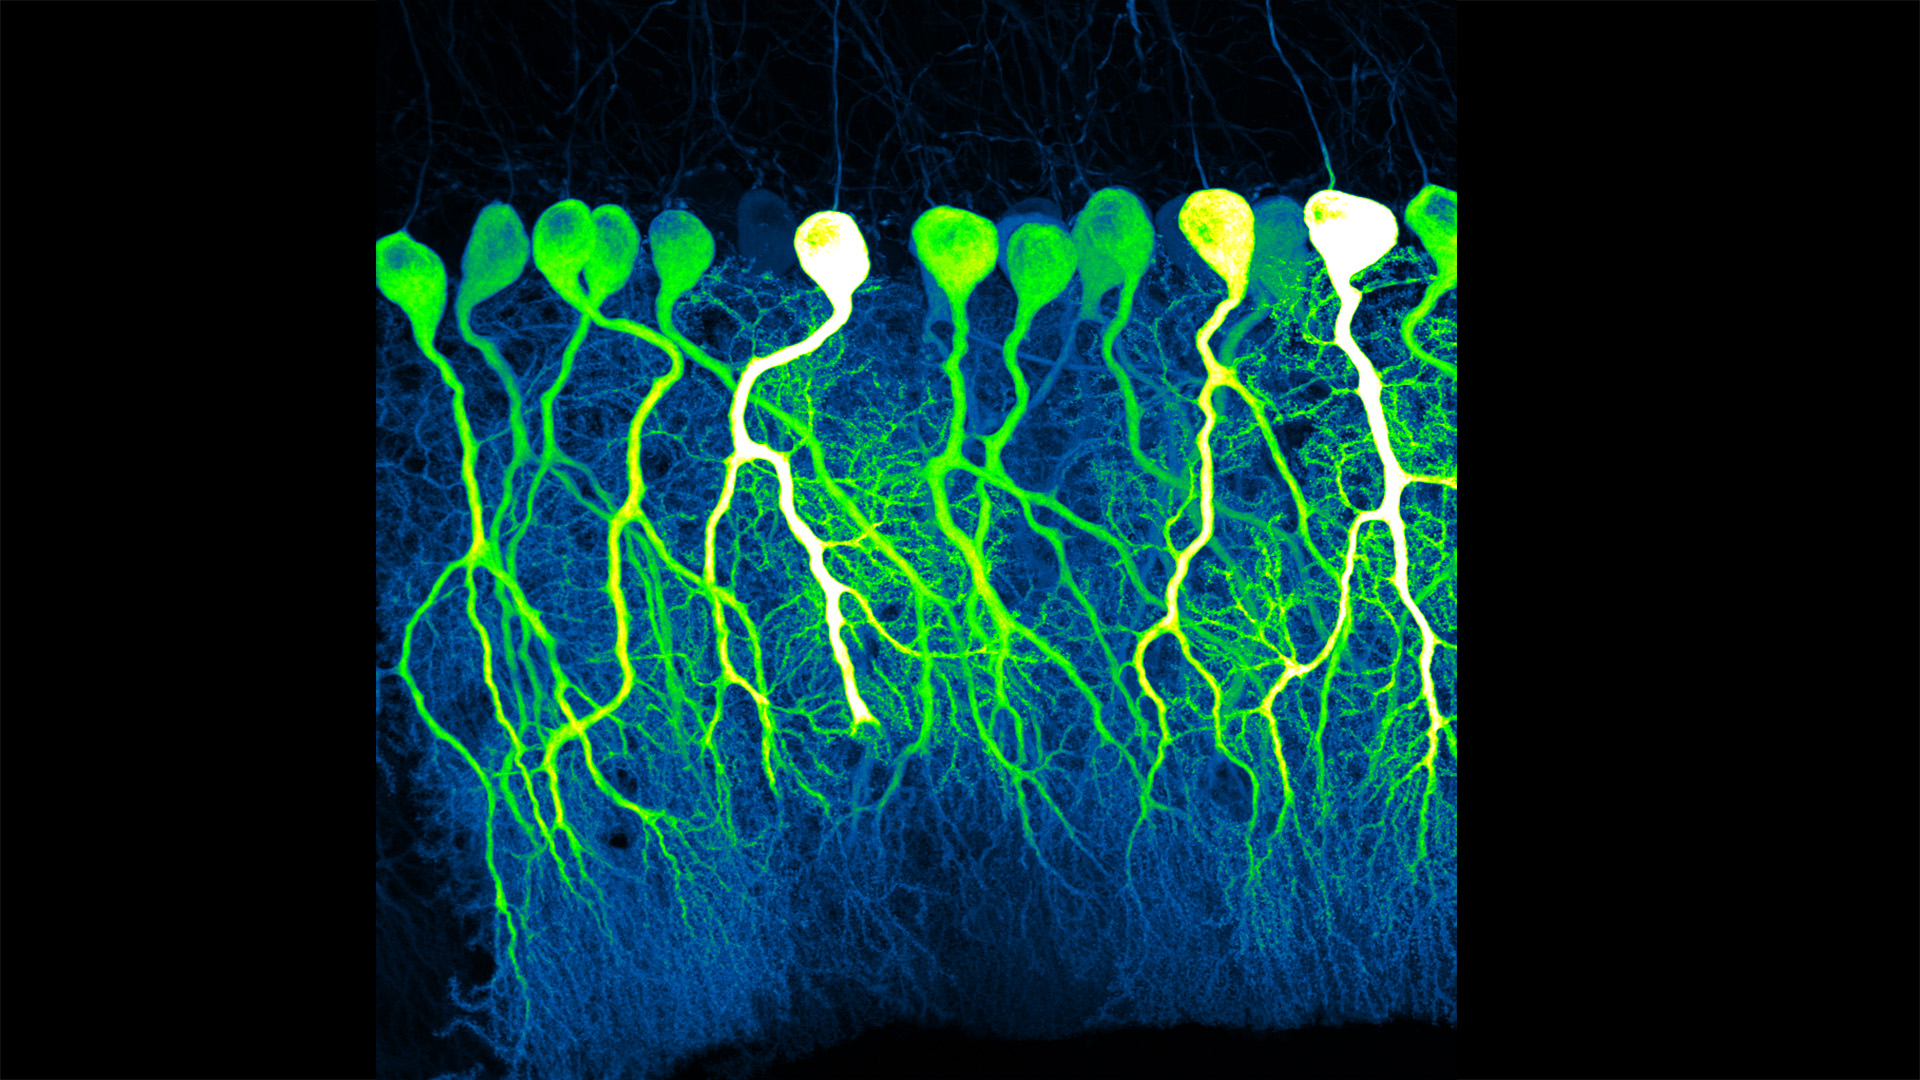
Silas Busch at the University of Chicago captured this slightly eerie scene, noting it reminded him of people shuffling through the dark of night. What you’re really seeing are some of the largest neurons in the mammalian brain, known as Purkinje cells. The photo won first place this year in the Brain Research through Advancing Innovative Neurotechnologies® (BRAIN) Initiative’s annual Show Us Your BRAINs! Photo and Video Contest.
While humans have them, too, the Purkinje cells pictured here are in the brain of a mouse. The head-like shapes you see in the image are the so-called soma, or the neurons’ cell bodies. Extending downwards are the heavily branched dendrites, which act like large antennae, receiving thousands of inputs from the rest of the body.
One reason this picture is such a standout, explains Busch, is because of what you don’t see. You’ll notice that only a few cells are fluorescently labeled and therefore lit up in green, leaving the rest in shadows. As a result, it’s possible to trace the detailed branches of individual Purkinje cells and make out their intricate forms. As it turns out, this ability to trace Purkinje cells so precisely led Busch, who is a graduate student in Christian Hansel’s lab focused on the neurobiology of learning and memory, to a surprising discovery, which the pair recently reported in Science.1
Purkinje cells connect to nerve fibers that “climb up” from the brain stem, which connects your brain and spinal cord to help control breathing, heart rate, balance and more. Scientists thought that each Purkinje cell received only one of these climbing fibers from the brain stem on its single primary branch.
However, after carefully tracing thousands of Purkinje cells in brain tissue from both mice and humans, the researchers have now shown that Purkinje cells and climbing fibers don’t always have a simple one-to-one relationship. In fact, Busch and Hansel found more than 95 percent of human Purkinje cells have multiple primary branches, not just one. In mice, that ratio is closer to 50 percent.
The researchers went on to show that mouse Purkinje cells with multiple primary branches often also receive multiple climbing fibers. The discovery rewrites the textbook idea of how Purkinje cells in the brain and climbing fibers from the brainstem are anatomically arranged.
Not surprisingly, those extra connections in the cerebellum (located in the back of the brain) also have important functional implications. When Purkinje cells have just one climbing fiber input, the new study shows, the whole cell receives each signal equally and responds accordingly. But, in cells with multiple climbing fiber inputs, the researchers could detect differences across a single cell depending on which primary branch received an input.
What this means is that Purkinje cells in the brain have much more computational power than had been appreciated. That extra brain power has important implications for understanding how brain circuits can adapt and respond to changes outside the body that now warrant further study. The new findings may have implications also for understanding the role of these Purkinje cell connections in some neurological and developmental disorders, including autism2 and a movement disorder known as cerebellar ataxia.
As they say, a picture is worth a thousand words. And this winning image comes as a reminder that we still have more to learn from careful study of basic brain anatomy, with important implications for human health and disease.
References:
[1] SE Busch and C Hansel. Climbing fiber multi-innervation of mouse Purkinje dendrites with arborization common to human. Science. DOI: 10.1126/science.adi1024. (2023).
[2] DH Simmons et al. Sensory Over-responsivity and Aberrant Plasticity in Cerebellar Cortex in a Mouse Model of Syndromic Autism. Biological Psychiatry: Global Open Science. DOI: 10.1016/j.bpsgos.2021.09.004. (2021).
How to Feed a Macrophage
Posted on by Lawrence Tabak, D.D.S., Ph.D.
For Annalise Bond, a graduate student in the lab of Meghan Morrissey, University of California, Santa Barbara (UCSB), macrophages are “the professional eaters of our immune system.” Every minute of every day, macrophages somewhere in the body are gorging themselves to remove the cellular debris that builds up in our tissues and organs.
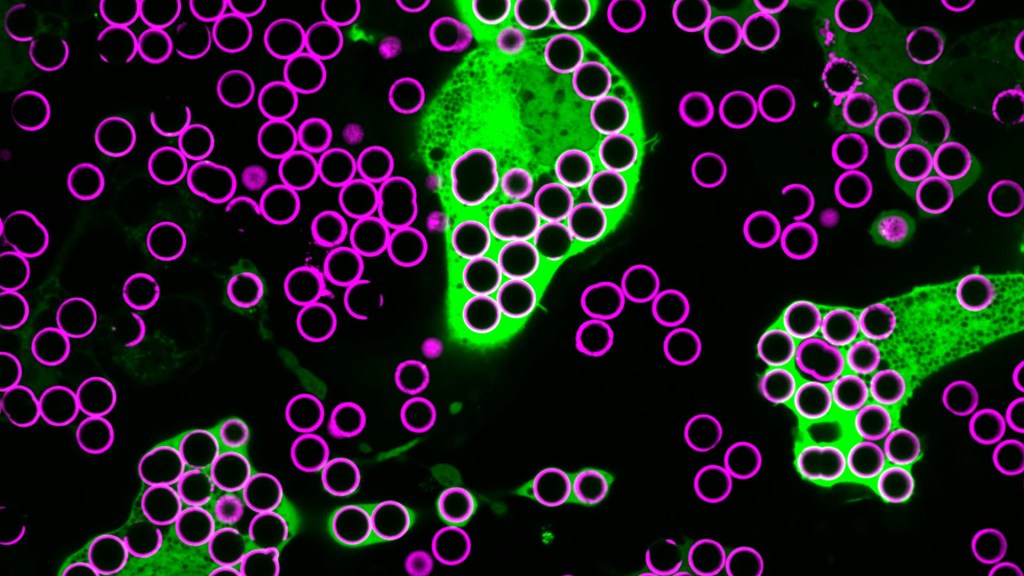
In this image, Bond caught several macrophages (green) doing what they do best: shoveling it in—in this case, during a lab experiment. The macrophages are consuming silica beads (purple) prepared with biochemicals that whet their appetites. Each bead measures about five microns in diameter. That’s roughly the size of a bacterium or a spent red blood cell—debris that a macrophage routinely consumes.
When Bond snapped this image, she noticed a pattern that reminded her of a childhood tabletop game called Hungry Hungry Hippos. Kids press a lever attached to the mouth of a plastic hippo, its lower jaw flaps open, and the challenge is to fill the mouth with as many marbles as possible . . . just like the macrophages eating beads.
Bond adjusted the colors in the photo to make them pop. She then entered it into UCSB’s 2023 Art of Science contest with the caption of Hungry Hungry Macrophages, winning high marks for drawing the association.
Though the caption was written in fun, Bond studies in earnest a fascinating biological question: How do macrophages know what to eat in the body and what to leave untouched?
In her studies, Bond coats the silica beads shown above with a lipid bilayer to mimic a cell membrane. To that coating, she adds various small molecules and proteins as “eat-me” signals often found on the surface of dying cells. Some of the signals are well characterized; but many aren’t, meaning there’s still a lot to learn about what makes a macrophage “particularly hungry” and what makes a particular target cell “extra tasty.”
Capturing fluorescent images of macrophages under the microscope, Bond counts up how many beads are eaten. Beads bearing no signal to stimulate their appetite might get eaten occasionally. But when an especially enticing signal is added, macrophages will gorge themselves until they can’t eat anymore.
In the experiment pictured above, the beads contain the antibody immunoglobulin G (IgG), which tags foreign pathogens for macrophage removal. Interestingly, IgG antibody responses also play an important role in cancer immunotherapies, in which the immune system is unleashed to fight cancer.
Among its many areas of study, the NIH-supported Morrissey lab’s wants to understand better how macrophages interact with cancer cells. They want to learn how to make cancer cells even tastier to macrophages and program their elimination from the body. Sorting out the signals will be challenging, but we know that macrophages will take a bite at the right ones. They are, after all, professional eaters.
Links:
Cancer Immunotherapy (NIH)
Annalise Bond (University of California, Santa Barbara)
Morrissey Lab (University of California, Santa Barbara)
Art of Science (University of California, Santa Barbara)
NIH Support: National Institute of General Medical Sciences
Science, Serendipity, and Art
Posted on by Lawrence Tabak, D.D.S., Ph.D.
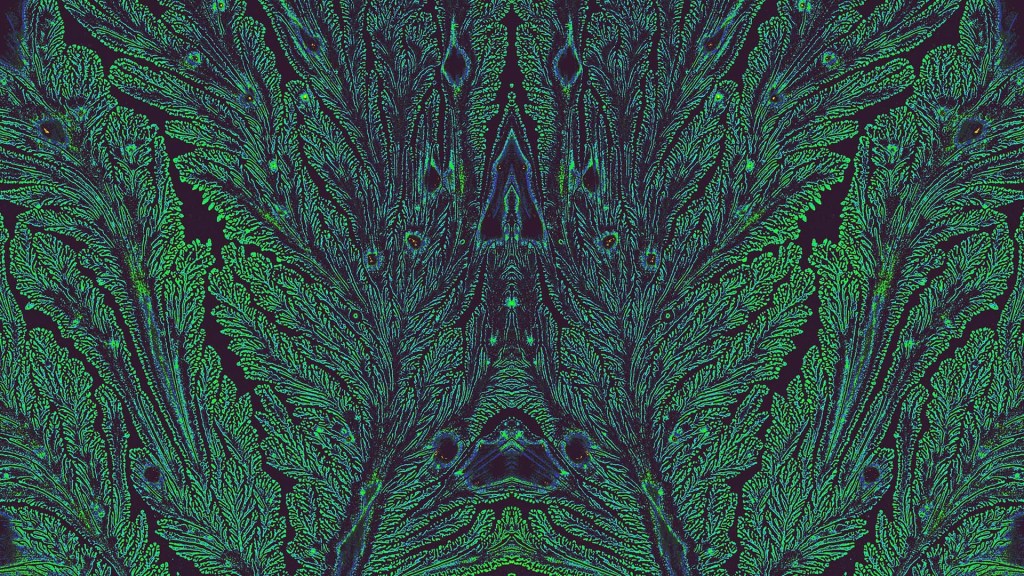
Fractals are complex geometric patterns repeated at progressively smaller scales. You’ll find them throughout nature. That includes in the 3D structures and shapes of tissues throughout our bodies, from the bones in our skulls down to the blood vessels in our feet. But the fractal pattern above isn’t from a precisely patterned human tissue. It comes from some unexpected biochemistry that formed the stunning pattern on its own.
In fact, the exact source for this fractal pattern reminiscent of peacock feathers isn’t known. It turned up out of the blue (and green) in a sample that had been sitting around on the shelf for some time. The original image appeared in black and white, but the colors added post-collection help to highlight the fractal pattern of a sample including an essential hormone produced in the pancreas. The hormone is called islet amyloid polypeptide (IAPP).
Also known as amylin, IAPP plays many important roles in our bodies, including the feeling of fullness after a meal. But the amino acid chains that make up IAPP also are prone to forming abnormal clumps of misfolded polypeptides (a long name for proteins) known as amyloids. Much like the amyloid plaques in the brains of people with Alzheimer’s disease, misfolded IAPP amyloids in people with type 2 diabetes also can damage insulin-producing beta cells in the pancreas and make controlling their blood sugar levels even more difficult.
This unusual image comes from graduate students Bryan Bogin and Matthew Steinsaltz. They study the biophysics and biochemistry of protein folding and misfolding in the lab of Zachary Levine, Yale School of Medicine, New Haven, CT. The Levine lab recently moved to the Altos Labs San Diego Institute. However, Bogin and Steinsaltz continue to conduct their studies at Yale.
The two conduct in-solution experiments and molecular simulations to elucidate the precise conditions and triggers that can lead otherwise normal polypeptide chains to fold up incorrectly and wreak havoc as they do in diabetes and other diseases. When Steinsaltz was learning how to use transmission electron microscopy (TEM), a technique in which an electron beam captures images including detailed molecular-level structures, Bogin handed over an assortment of IAPP samples in different solution conditions from some of his past experiments for a look.
In those microscopy images, they expected to see long, linear fibrils consisting of IAPP polypeptides. While that’s indeed what they saw in most of the samples, this one was the exception. It was such a remarkable image that they submitted it in the Biophysical Society’s 2022 Art of Science Image Contest, where it took the top prize.
Bogin and Steinsaltz say they still can’t explain the source or meaning behind these unusual fractal patterns. But they do continue to conduct experiments to understand how various polypeptides implicated in health and disease misfold to form destructive aggregates. This striking image may not hold the answers they seek, but it is an inspiring reminder that the path to making groundbreaking biomedical discoveries will have many beautiful surprises along the way.
Links:
Type 2 Diabetes (National Institute of Diabetes and Digestive and Kidney Diseases/NIH)
Zachary Levine Lab (Yale School of Medicine, New Haven, CT)
Art of Science Image Contest (Biophysical Society, Rockville, MD)
NIH Support: National Institute on Aging
How Neurons Make Connections
Posted on by Lawrence Tabak, D.D.S., Ph.D.

For many people, they are tiny pests. These fruit flies that sometimes hover over a bowl of peaches or a bunch of bananas. But for a dedicated community of researchers, fruit flies are an excellent model organism and source of information into how neurons self-organize during the insect’s early development and form a complex, fully functioning nervous system.
That’s the scientific story on display in this beautiful image of a larval fruit fly’s developing nervous system. Its subtext is: fundamental discoveries in the fruit fly, known in textbooks as Drosophila melanogaster, provide basic clues into the development and repair of the human nervous system. That’s because humans and fruit flies, though very distantly related through the millennia, still share many genes involved in their growth and development. In fact, 60 percent of the Drosophila genome is identical to ours.
Once hatched, as shown in this image, a larval fly uses neurons (magenta) to sense its environment. These include neurons that sense the way its body presses against the surrounding terrain, as needed to coordinate the movements of its segmented body parts and crawl in all directions.
This same set of neurons will generate painful sensations, such as the attack of a parasitic wasp. Paintbrush-like neurons in the fly’s developing head (magenta, left side) allow the insect to taste the sweetness of a peach or banana.
There is a second subtype of neurons, known as proprioceptors (green). These neurons will give the young fly its “sixth sense” understanding about where its body is positioned in space. The complete collection of developing neurons shown here are responsible for all the fly’s primary sensations. They also send these messages on to the insect’s central nervous system, which contains thousands of other neurons that are hidden from view.
Emily Heckman, now a postdoctoral researcher at the Michigan Neuroscience Institute, University of Michigan, Ann Arbor, captured this image during her graduate work in the lab of Chris Doe, University of Oregon, Eugene. For her keen eye, she received a trainee/early-career BioArt Award from the Federation of American Societies for Experimental Biology (FASEB), which each year celebrates the art of science.
The image is one of many from a much larger effort in the Doe lab that explores the way neurons that will partner find each other and link up to drive development. Heckman and Doe also wanted to know how neurons in the developing brain interconnect into integrated neural networks, or circuits, and respond when something goes wrong. To find out, they disrupted sensory neurons or forced them to take alternate paths and watched to see what would happen.
As published in the journal eLife [1], the system has an innate plasticity. Their findings show that developing sensory neurons instruct one another on how to meet up just right. If one suddenly takes an alternate route, its partner can still reach out and make the connection. Once an electrically active neural connection, or synapse, is made, the neural signals themselves slow or stop further growth. This kind of adaptation and crosstalk between neurons takes place only during a particular critical window during development.
Heckman says part of what she enjoys about the image is how it highlights that many sensory neurons develop simultaneously and in a coordinated process. What’s also great about visualizing these events in the fly embryo is that she and other researchers can track many individual neurons from the time they’re budding stem cells to when they become a fully functional and interconnected neural circuit.
So, the next time you see fruit flies hovering in the kitchen, just remember there’s more to their swarm than you think. Our lessons learned studying them will help point researchers toward new ways in people to restore or rebuild neural connections after devastating disruptions from injury or disease.
Reference:
Presynaptic contact and activity opposingly regulate postsynaptic dendrite outgrowth. Heckman EL, Doe CQ. Elife. 2022 Nov 30;11:e82093.
Links:
Research Organisms (National Institute of General Medical Sciences/NIH)
Doe Lab (University of Oregon, Eugene)
Emily Heckman (University of Michigan, Ann Arbor)
BioArt Awards (Federation of American Societies for Experimental Biology, Rockville, MD)
NIH Support: Eunice Kennedy Shriver National Institute of Child Health and Human Development
Saving Fat for Lean Times
Posted on by Lawrence Tabak, D.D.S., Ph.D.
Humans and all multi-celled organisms, or metazoans, have evolved through millennia into a variety of competing shapes, sizes, and survival strategies. But all metazoans still share lots of intriguing cell biology, including the ability to store excess calories as fat. In fact, many researchers now consider fat-storing cells to be “nutrient sinks,” or good places for the body to stash excess sugars and lipids. Not only can these provide energy needed to survive a future famine, this is a good way to sequester extra molecules that could prove toxic to cells and organs.
Here’s something to think about the next time you skip a meal. Fat-storing cells organize their fat reserves spatially, grouping them into specific pools of lipid types, in order to generate needed energy when food is scarce.
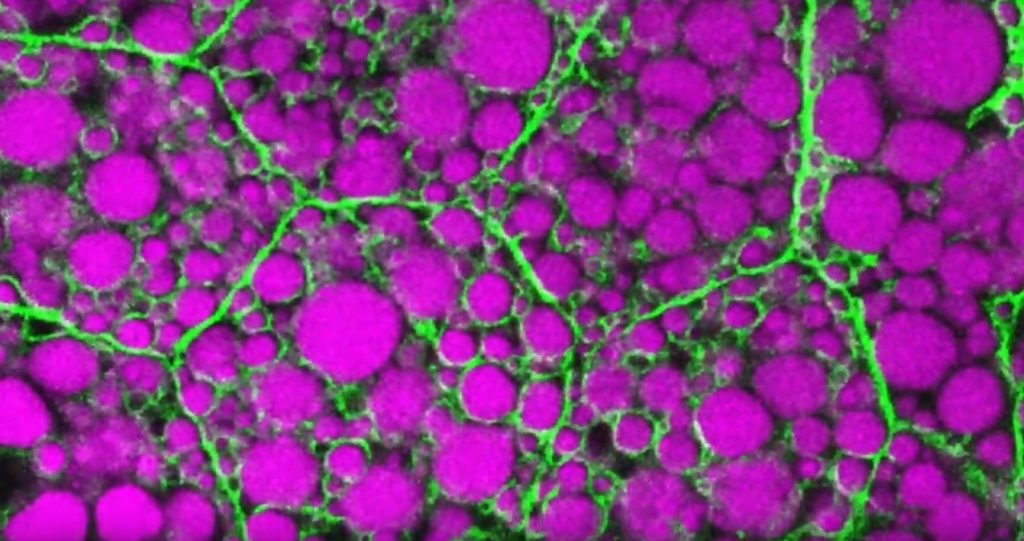
That’s the story behind this striking image taken in a larval fruit fly (Drosophila melanogaster). The image captures fat-storing adipocytes in an organ called a fat body, where a larval fruit fly stores extra nutrients. It’s like the fat tissue in mammals. You can see both large and small lipid droplets (magenta) inside polygon-shaped fat cells, or adipocytes, lined by their plasma membranes (green). But notice that the small lipid droplets are more visibly lined by green, as only these are destined to be saved for later and exported when needed into the fly’s bloodstream.
Working in Mike Henne’s lab at the University of Texas Southwestern Medical Center, Dallas, research associate Rupali Ugrankar discovered how this clever fat-management system works in Drosophila [1]. After either feeding flies high-or-extremely low-calorie diets, Ugrankar used a combination of high-resolution fluorescence confocal microscopy and thin-section transmission electron microscopy to provide a three-dimensional view of adipocytes and their lipid droplets inside.
She observed two distinct sizes of lipid droplets and saw that only the small ones clustered at the cell surface membrane. The adipocytes contorted their membrane inward to grab these small droplets and package them into readily exportable energy bundles.
Ugrankar saw that during times of plenty, a protein machine could fill these small membrane-wrapped fat droplets with lots of triacylglycerol, a high-energy, durable form of fat storage. Their ready access at the surface of the adipocyte allows the fly to balance lipid storage locally with energy release into its blood in times of famine.
Ugrankar’s adeptness at the microscope resulted in this beautiful photo, which was earlier featured in the American Society for Cell Biology’s Green Fluorescent Protein Image and Video Contest. But her work and that of many others help to open a vital window into nutrition science and many critical mechanistic questions about the causes of obesity, insulin resistance, hyperglycemia, and even reduced lifespan.
Such basic research will provide the basis for better therapies to correct these nutrition-related health problems. But the value of basic science must not be forgotten—some of the most important leads could come from a tiny insect in its larval state that shares many aspects of mammalian metabolism.
Reference:
[1] Drosophila Snazarus regulates a lipid droplet population at plasma membrane-droplet contacts in adipocytes. Ugrankar R, Bowerman J, Hariri H, Chandra M, et al. Dev Cell. 2019 Sep 9;50(5):557-572.e5.
Links:
The Interactive Fly (Society for Developmental Biology, Rockville, MD)
Henne Lab (University of Texas Southwestern Medical Center, Dallas)
NIH Support: National Institute of General Medical Sciences
An Inflammatory View of Early Alzheimer’s Disease
Posted on by Lawrence Tabak, D.D.S., Ph.D.
Detecting the earliest signs of Alzheimer’s disease (AD) in middle-aged people and tracking its progression over time in research studies continue to be challenging. But it is easier to do in shorter-lived mammalian models of AD, especially when paired with cutting-edge imaging tools that look across different regions of the brain. These tools can help basic researchers detect telltale early changes that might point the way to better prevention or treatment strategies in humans.
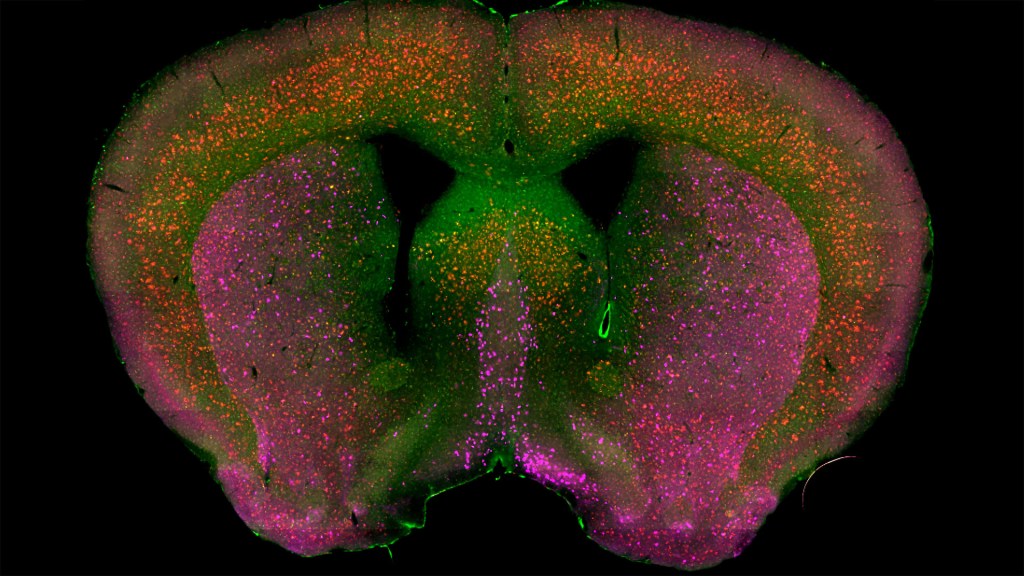
That’s the case in this technicolor snapshot showing early patterns of inflammation in the brain of a relatively young mouse bred to develop a condition similar to AD. You can see abnormally high levels of inflammation throughout the front part of the brain (orange, green) as well as in its middle part—the septum that divides the brain’s two sides. This level of inflammation suggests that the brain has been injured.
What’s striking is that no inflammation is detectable in parts of the brain rich in cholinergic neurons (pink), a distinct type of nerve cell that helps to control memory, movement, and attention. Though these neurons still remain healthy, researchers would like to know if the inflammation also will destroy them as AD progresses.
This colorful image comes from medical student Sakar Budhathoki, who earlier worked in the NIH labs of Lorna Role and David Talmage, National Institute of Neurological Disorders and Stroke (NINDS). Budhathoki, teaming with postdoctoral scientist Mala Ananth, used a specially designed wide-field scanner that sweeps across brain tissue to light up fluorescent markers and capture the image. It’s one of the scanning approaches pioneered in the Role and Talmage labs [1,2].
The two NIH labs are exploring possible links between abnormal inflammation and damage to the brain’s cholinergic signaling system. In fact, medications that target cholinergic function remain the first line of treatment for people with AD and other dementias. And yet, researchers still haven’t adequately determined when, why, and how the loss of these cholinergic neurons relates to AD.
It’s a rich area of basic research that offers hope for greater understanding of AD in the future. It’s also the source of some fascinating images like this one, which was part of the 2022 Show Us Your BRAIN! Photo and Video Contest, supported by NIH’s Brain Research Through Advancing Innovative Neurotechnologies® (BRAIN) Initiative.
References:
[1] NeuRegenerate: A framework for visualizing neurodegeneration. Boorboor S, Mathew S, Ananth M, Talmage D, Role LW, Kaufman AE. IEEE Trans Vis Comput Graph. 2021;Nov 10;PP.
[2] NeuroConstruct: 3D reconstruction and visualization of neurites in optical microscopy brain images. Ghahremani P, Boorboor S, Mirhosseini P, Gudisagar C, Ananth M, Talmage D, Role LW, Kaufman AE. IEEE Trans Vis Comput Graph. 2022 Dec;28(12):4951-4965.
Links:
Alzheimer’s Disease & Related Dementias (National Institute on Aging/NIH)
Role Lab (National Institute of Neurological Disorders and Stroke/NIH)
Talmage Lab (NINDS)
The Brain Research Through Advancing Innovative Neurotechnologies® (BRAIN) Initiative (NIH)
Show Us Your BRAINs! Photo and Video Contest (BRAIN Initiative)
NIH Support: National Institute of Neurological Disorders and Stroke
The Amazing Brain: Where Thoughts Trigger Body Movement
Posted on by Lawrence Tabak, D.D.S., Ph.D.

You’re looking at a section of a mammalian motor cortex (left), the part of the brain where thoughts trigger our body movements. Part of the section is also shown (right) in higher resolution to help you see the intricate details.
These views are incredibly detailed, and they also can’t be produced on a microscope or any current state-of-the-art imaging device. They were created on a supercomputer. Researchers input vast amounts of data covering the activity of the motor cortex to model this highly detailed and scientifically accurate digital simulation.
The vertical section (left) shows a circuit within a column of motor neurons. The neurons run from the top, where the brain meets the skull, downward to the point that the motor cortex connects with other brain areas.
The various colors represent different layers of the motor cortex, and the bright spots show where motor neurons are firing. Notice the thread-like extensions of the motor neurons, some of which double back to connect cells from one layer with others some distance away. All this back and forth makes it appear as though the surface is unraveling.
This unique imaging was part of this year’s Show Us Your Brain Photo and Video contest, supported by NIH’s Brain Research through Advancing Innovative Neurotechnologies® (BRAIN) Initiative. Nicolas Antille, an expert in turning scientific data into accurate and compelling visuals, created the images using a scientific model developed in the lab of Salvador Dura-Bernal, SUNY Downstate Health Sciences University, Brooklyn, NY. In the Dura-Bernal lab, scientists develop software and highly detailed computational models of neural circuits to better understand how they give rise to different brain functions and behavior [1].
Antille’s images make the motor neurons look densely packed, but in life the density would be five times as much. Antille has paused the computer simulation at a resolution that he found scientifically and visually interesting. But the true interconnections among neurons, or circuits, inside a real brain—even a small portion of a real brain—are more complex than the most powerful computers today can fully process.
While Antille is invested in revealing brain circuits as close to reality as possible, he also has the mind of an artist. He works with the subtle interaction of light with these cells to show how many individual neurons form this much larger circuit. Here’s more of his artistry at work. Antille wants to invite us all to ponder—even if only for a few moments—the wondrous beauty of the mammalian brain, including this remarkable place where thoughts trigger movements.
Reference:
[1] NetPyNE, a tool for data-driven multiscale modeling of brain circuits. Dura-Bernal S, Suter BA, Gleeson P, Cantarelli M, Quintana A, Rodriguez F, Kedziora DJ, Chadderdon GL, Kerr CC, Neymotin SA, McDougal RA, Hines M, Shepherd GM, Lytton WW. Elife. 2019 Apr 26;8:e44494.
Links:
Dura-Bernal Lab (State University of New York Downstate, Brooklyn)
Brain Research through Advancing Innovative Neurotechnologies® (BRAIN) Initiative (NIH)
Show Us Your BRAINs Photo & Video Contest (BRAIN Initiative)
NIH Support: National Institute of Biomedical Imaging and Bioengineering; National Institute of Neurological Disorders and Stroke; BRAIN Initiative
The Amazing Brain: Tight-Knit Connections
Posted on by Lawrence Tabak, D.D.S., Ph.D.
You’ve likely seen pictures of a human brain showing its smooth, folded outer layer, known as the cerebral cortex. Maybe you’ve also seen diagrams highlighting some of the brain’s major internal, or subcortical, structures.
These familiar representations, however, overlook the brain’s intricate internal wiring that power our thoughts and actions. This wiring consists of tightly bundled neural projections, called fiber tracts, that connect different parts of the brain into an integrated neural communications network.
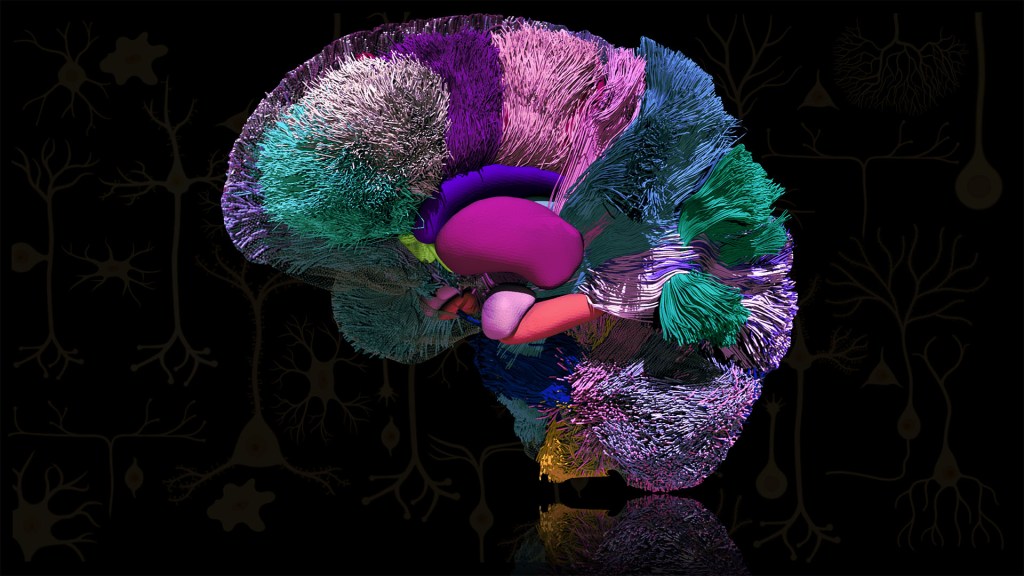
The actual patterns of these fiber tracts are represented here and serve as the featured attraction in this award-winning image from the 2022 Show Us Your BRAINs Photo and Video contest. The contest is supported by NIH’s Brain Research through Advancing Innovative Neurotechnologies® (BRAIN) Initiative.
Let’s take a closer look. At the center of the brain, you see some of the major subcortical structures: hippocampus (orange), amygdala (pink), putamen (magenta), caudate nucleus (purple), and nucleus accumbens (green). The fiber tracts are presented as colorful, yarn-like projections outside of those subcortical and other brain structures. The various colors, like a wiring diagram, distinguish the different fiber tracts and their specific connections.
This award-winning atlas of brain connectivity comes from Sahar Ahmad, Ye Wu, and Pew-Thian Yap, The University of North Carolina, Chapel Hill. The UNC Chapel Hill team produced this image using a non-invasive technique called diffusion MRI tractography. It’s an emerging approach with many new possibilities for neuroscience and the clinic [1]. Ahmad’s team is putting it to work to map the brain’s many neural connections and how they change across the human lifespan.
In fact, the connectivity atlas you see here isn’t from a single human brain. It’s actually a compilation of images of the brains of multiple 30-year-olds. The researchers are using this brain imaging approach to visualize changes in the brain and its fiber tracts as people grow, develop, and mature from infancy into old age.
Sahar says their comparisons of such images show that early in life, many dynamic changes occur in the brain’s fiber tracts. Once a person reaches young adulthood, the connective wiring tends to stabilize until old age, when fiber tracts begin to break down. These and other similarly precise atlases of the human brain promise to reveal fascinating insights into brain organization and the functional dynamics of its architecture, now and in the future.
Reference:
[1] Diffusion MRI fiber tractography of the brain. Jeurissen B, Descoteaux M, Mori S, Leemans A. NMR Biomed. 2019 Apr;32(4):e3785.
Links:
Brain Basics: Know Your Brain (National Institute of Neurological Disorders and Stroke/NIH)
Sahar Ahmad (The University of North Carolina, Chapel Hill)
Ye Wu (The University of North Carolina, Chapel Hill)
Pew-Thian Yap (The University of North Carolina, Chapel Hill)
Brain Research through Advancing Innovative Neurotechnologies® (BRAIN) Initiative (NIH)
Show Us Your BRAINs Photo & Video Contest (BRAIN Initiative)
NIH Support: BRAIN Initiative; National Institute of Mental Health
The Amazing Brain: Seeing Two Memories at Once
Posted on by Lawrence Tabak, D.D.S., Ph.D.

The NIH’s Brain Research Through Advancing Innovative Neurotechnologies® (BRAIN) Initiative is revolutionizing our understanding of the human brain. As described in the initiative’s name, the development of innovative imaging technologies will enable researchers to see the brain in new and increasingly dynamic ways. Each year, the initiative celebrates some standout and especially creative examples of such advances in the “Show Us Your BRAINs! Photo & Video Contest. During most of August, I’ll share some of the most eye-catching developments in our blog series, The Amazing Brain.
In this fascinating image, you’re seeing two stored memories, which scientists call engrams, in the hippocampus region of a mouse’s brain. The engrams show the neural intersection of a good memory (green) and a bad memory (pink). You can also see the nuclei of many neurons (blue), including nearby neurons not involved in the memory formation.
This award-winning image was produced by Stephanie Grella in the lab of NIH-supported neuroscientist Steve Ramirez, Boston University, MA. It’s also not the first time that the blog has featured Grella’s technical artistry. Grella, who will soon launch her own lab at Loyola University, Chicago, previously captured what a single memory looks like.
To capture two memories at once, Grella relied on a technology known as optogenetics. This powerful method allows researchers to genetically engineer neurons and selectively activate them in laboratory mice using blue light. In this case, Grella used a harmless virus to label neurons involved in recording a positive experience with a light-sensitive molecule, known as an opsin. Another molecular label was used to make those same cells appear green when activated.
After any new memory is formed, there’s a period of up to about 24 hours during which the memory is malleable. Then, the memory tends to stabilize. But with each retrieval, the memory can be modified as it restabilizes, a process known as memory reconsolidation.
Grella and team decided to try to use memory reconsolidation to their advantage to neutralize an existing fear. To do this, they placed their mice in an environment that had previously startled them. When a mouse was retrieving a fearful memory (pink), the researchers activated with light associated with the positive memory (green), which for these particular mice consisted of positive interactions with other mice. The aim was to override or disrupt the fearful memory.
As shown by the green all throughout the image, the experiment worked. While the mice still showed some traces of the fearful memory (pink), Grella explained that the specific cells that were the focus of her study shifted to the positive memory (green).
What’s perhaps even more telling is that the evidence suggests the mice didn’t just trade one memory for another. Rather, it appears that activating a positive memory actually suppressed or neutralized the animal’s fearful memory. The hope is that this approach might one day inspire methods to help people overcome negative and unwanted memories, such as those that play a role in post-traumatic stress disorder (PTSD) and other mental health issues.
Links:
Stephanie Grella (Boston University, MA)
Ramirez Group (Boston University)
Brain Research through Advancing Innovative Neurotechnologies® (BRAIN) Initiative (NIH)
Show Us Your BRAINs Photo & Video Contest (BRAIN Initiative)
NIH Support: BRAIN Initiative; Common Fund
Capturing the Extracellular Matrix in 3D Color
Posted on by Dr. Francis Collins
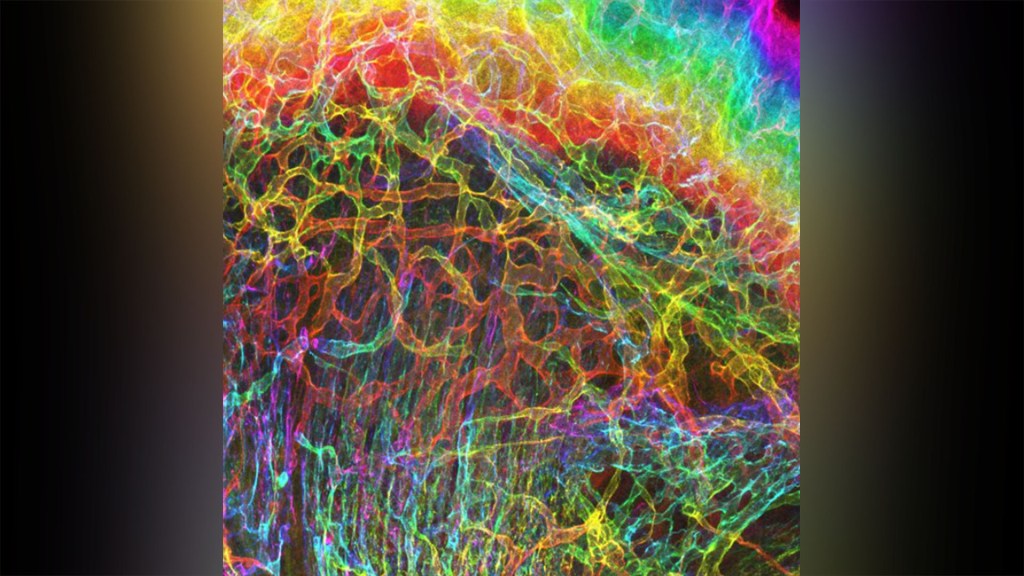
For experienced and aspiring shutterbugs alike, sometimes the best photo in the bunch turns out to be a practice shot. That’s also occasionally true in the lab when imaging cells and tissues, and it’s the story behind this spectacular image showing the interface of skin and muscle during mammalian development.
Here you see an area of the mouse forelimb located near a bone called the humerus. This particular sample was labeled for laminin, a protein found in the extracellular matrix (ECM) that undergirds cells and tissues to give them mechanical and biochemical support. Computer algorithms were used to convert the original 2D confocal scan into a 3D image, and colorization was added to bring the different layers of tissue into sharper relief.
Skin tissue (bright red and yellow) is located near the top of the image; blood vessels (paler red, orange, and yellow) are in the middle and branching downward; and muscle (green, blue, and purple) makes up the bottom layer.
The image was created by Sarah Lipp, a graduate student in the NIH-supported tissue engineering lab of Sarah Calve. The team focuses on tissue interfaces to better understand the ECM and help devise strategies to engineer musculoskeletal tissues, such as tendon and cartilage.
In February 2020, Lipp was playing around with some new software tools for tissue imaging. Before zeroing in on her main target—the mouse’s myotendinous junction, where muscle transfers its force to tendon, Lipp snapped this practice shot of skin meeting muscle. After processing the practice shot with a color-projecting macro in an image processing tool called Fiji, she immediately liked what she saw.
So, Lipp tweaked the color a bit more and entered the image in the 2020 BioArt Scientific Image & Video Competition, sponsored by the Federation of American Societies for Experimental Biology, Bethesda, MD. Last December, the grad student received the good news that her practice shot had snagged one of the prestigious contest’s top awards.
But she’s not stopping there. Lipp is continuing to pursue her research interests at the University of Colorado, Boulder, where the Calve lab recently moved from Purdue University, West Lafayette, IN. Here’s wishing her a career filled with more great images—and great science!
Links:
Muscle and Bone Diseases (National Institute of Arthritis and Musculoskeletal and Skin Diseases/NIH)
Musculoskeletal Extracellular Matrix Laboratory (University of Colorado, Boulder)
BioArt Scientific Image & Video Competition (Federation of American Societies for Experimental Biology, Bethesda, MD)
NIH Support: National Institute of Arthritis and Musculoskeletal and Skin Diseases
Next Page