tractography
The Amazing Brain: Tight-Knit Connections
Posted on by Lawrence Tabak, D.D.S., Ph.D.
You’ve likely seen pictures of a human brain showing its smooth, folded outer layer, known as the cerebral cortex. Maybe you’ve also seen diagrams highlighting some of the brain’s major internal, or subcortical, structures.
These familiar representations, however, overlook the brain’s intricate internal wiring that power our thoughts and actions. This wiring consists of tightly bundled neural projections, called fiber tracts, that connect different parts of the brain into an integrated neural communications network.
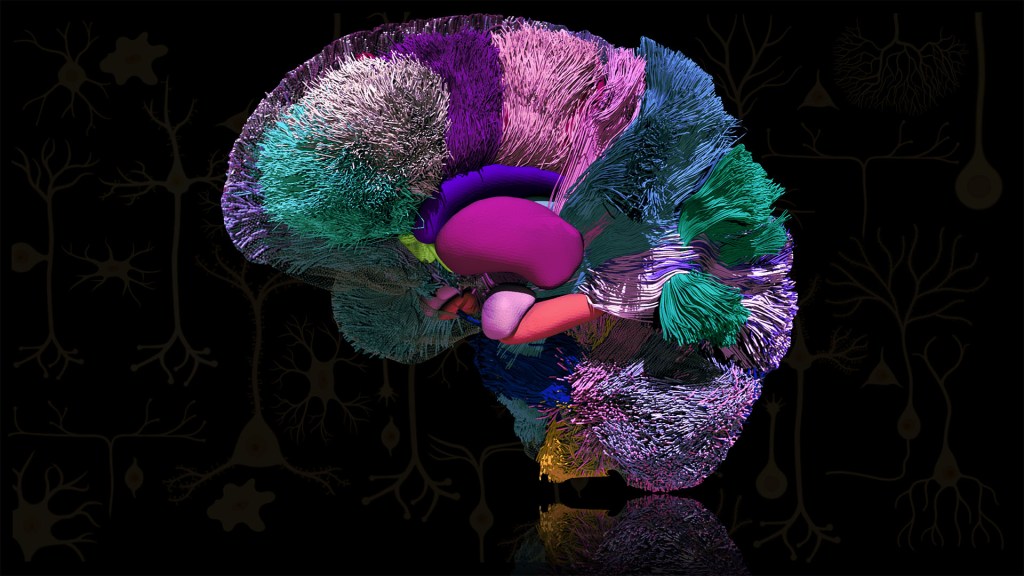
The actual patterns of these fiber tracts are represented here and serve as the featured attraction in this award-winning image from the 2022 Show Us Your BRAINs Photo and Video contest. The contest is supported by NIH’s Brain Research through Advancing Innovative Neurotechnologies® (BRAIN) Initiative.
Let’s take a closer look. At the center of the brain, you see some of the major subcortical structures: hippocampus (orange), amygdala (pink), putamen (magenta), caudate nucleus (purple), and nucleus accumbens (green). The fiber tracts are presented as colorful, yarn-like projections outside of those subcortical and other brain structures. The various colors, like a wiring diagram, distinguish the different fiber tracts and their specific connections.
This award-winning atlas of brain connectivity comes from Sahar Ahmad, Ye Wu, and Pew-Thian Yap, The University of North Carolina, Chapel Hill. The UNC Chapel Hill team produced this image using a non-invasive technique called diffusion MRI tractography. It’s an emerging approach with many new possibilities for neuroscience and the clinic [1]. Ahmad’s team is putting it to work to map the brain’s many neural connections and how they change across the human lifespan.
In fact, the connectivity atlas you see here isn’t from a single human brain. It’s actually a compilation of images of the brains of multiple 30-year-olds. The researchers are using this brain imaging approach to visualize changes in the brain and its fiber tracts as people grow, develop, and mature from infancy into old age.
Sahar says their comparisons of such images show that early in life, many dynamic changes occur in the brain’s fiber tracts. Once a person reaches young adulthood, the connective wiring tends to stabilize until old age, when fiber tracts begin to break down. These and other similarly precise atlases of the human brain promise to reveal fascinating insights into brain organization and the functional dynamics of its architecture, now and in the future.
Reference:
[1] Diffusion MRI fiber tractography of the brain. Jeurissen B, Descoteaux M, Mori S, Leemans A. NMR Biomed. 2019 Apr;32(4):e3785.
Links:
Brain Basics: Know Your Brain (National Institute of Neurological Disorders and Stroke/NIH)
Sahar Ahmad (The University of North Carolina, Chapel Hill)
Ye Wu (The University of North Carolina, Chapel Hill)
Pew-Thian Yap (The University of North Carolina, Chapel Hill)
Brain Research through Advancing Innovative Neurotechnologies® (BRAIN) Initiative (NIH)
Show Us Your BRAINs Photo & Video Contest (BRAIN Initiative)
NIH Support: BRAIN Initiative; National Institute of Mental Health
The Amazing Brain: A Sharper Image of the Pyramidal Tract
Posted on by Dr. Francis Collins
Flip the image above upside down, and the shape may remind you of something. If you think it resembles a pyramid, then you and a lot of great neuroscientists are thinking alike. What you are viewing is a colorized, 3D reconstruction of a pyramidal tract, which are bundles of nerve fibers that originate from the brain’s cerebral cortex and relay signals to the brainstem or the spinal cord. These signals control many important activities, including the voluntary movement of our arms, legs, head, and face.
For a while now, it’s been possible to combine a specialized form of magnetic resonance imaging (MRI) with computer modeling tools to produce 3D reconstructions of complicated networks of nerve fibers, such as the pyramidal tract. Still, for technical reasons, the quality of these reconstructions has remained poor in parts of the brain where nerve fibers cross at angles of 40 degrees or less.
The video above demonstrates how adding a sophisticated algorithm, called Orientation Distribution Function (ODF)-Fingerprinting, to such modeling can help overcome this problem when reconstructing a pyramidal tract. It has potential to enhance the reliability of these 3D reconstructions as neurosurgeons begin to use them to plan out their surgeries to help ensure they are carried out with the utmost safety and precision.
In the first second of the video, you see gray, fuzzy images from a diffusion MRI of the pyramidal tract. But, very quickly, a more colorful, detailed 3D reconstruction begins to appear, swiftly filling in from the top down. Colors are used to indicate the primary orientations of the nerve fibers: left to right (red), back to front (green), and top to bottom (blue). The orange, magenta, and other colors represent combinations of these primary directional orientations.
About three seconds into the video, a rough draft of the 3D reconstruction is complete. The top of the pyramidal tract looks pretty good. However, looking lower down, you can see distortions in color and relatively poor resolution of the nerve fibers in the middle of the tract—exactly where the fibers cross each other at angles of less than 40 degrees. So, researchers tapped into the power of their new ODF-Fingerprinting software to improve the image—and, starting about nine seconds into the video, you can see an impressive final result.
The researchers who produced this amazing video are Patryk Filipiak and colleagues in the NIH-supported lab of Steven Baete, Center for Advanced Imaging Innovation and Research, New York University Grossman School of Medicine, New York. The work paired diffusion MRI data from the NIH Human Connectome Project with the ODF-Fingerprinting algorithm, which was created by Baete to incorporate additional MRI imaging data on the shape of nerve fibers to infer their directionality [1].
This innovative approach to imaging recently earned Baete’s team second place in the 2021 “Show Us Your BRAINs” Photo and Video contest, sponsored by the NIH-led Brain Research through Advancing Innovative Neurotechnologies® (BRAIN) Initiative. But researchers aren’t stopping there! They are continuing to refine ODF-Fingerprinting, with the aim of modeling the pyramidal tract in even higher resolution for use in devising new and better ways of helping people undergoing neurosurgery.
Reference:
[1] Fingerprinting Orientation Distribution Functions in diffusion MRI detects smaller crossing angles. Baete SH, Cloos MA, Lin YC, Placantonakis DG, Shepherd T, Boada FE. Neuroimage. 2019 Sep;198:231-241.
Links:
Brain Research through Advancing Innovative Neurotechnologies® (BRAIN) Initiative (NIH)
Human Connectome Project (University of Southern California, Los Angeles)
Steven Baete (Center for Advanced Imaging Innovation and Research, New York University Grossman School of Medicine, New York)
Show Us Your BRAINs! Photo and Video Contest (BRAIN Initiative/NIH)
NIH Support: National Institute of Biomedical Imaging and Bioengineering; National Institute of Neurological Disorders and Stroke; National Cancer Institute
The Amazing Brain: Mapping Brain Circuits in Vivid Color
Posted on by Dr. Francis Collins
Hop aboard as we fly up, down, left, and right through the information highways of the human brain! This captivating and eye-catching video was one of the winners of the 2019 “Show us Your Brain!” contest sponsored by the NIH-led Brain Research through Advancing Innovative Neurotechnologies® (BRAIN) Initiative.
The video travels through several portions of the brain’s white matter—bundles of fiber that carry nerve signals between the brain and the body, as well as within the brain itself. Fiber colors indicate directionality: left-right fibers (red), front-back fibers (green), and top-bottom fibers (blue).
Looking from the back, we start our journey deep within the brain in the limbic system, the area that helps control emotion, learning, and memory. About three seconds in, visual fibers pop into view extending from the eyes to various brain areas into the occipital lobe (one of four major brain lobes) in the back of the brain.
About two seconds later, flying over top as the brain starts rotating, we see various fiber bundles spray upward throughout the cerebral cortex, communicating information related to language processing, short-term memory, and other functions. About halfway through the video, several green bundles emerge arching across the brain’s midline. These bundles, called the corpus callosum, house the fibers enabling communication between left and right sides of the brain. Finally, the video closes as we see many different fiber bundles lighting up all over, enabling communication between different cortical and subcortical portions of the brain through association and projection pathways.
Dynamic maps like these are created using a 3D imaging technique called diffusion MRI tractography [1]. The technique tracks subtle pathways of water movement in the brain, and allows researchers to model the physical properties (connectional anatomy) that underlie the brain’s electrical properties (neuronal signaling). Postdoctoral researcher Ryan Cabeen and Arthur Toga, director of the University of Southern California Mark and Mary Stevens Neuroimaging and Informatics Institute, Los Angeles, used the method to study how white matter changes in developing and aging brains, as well as in brains affected by neurodegenerative or neurological disorders.
Scientific animator Jim Stanis produced the video with Cabeen and Toga. The team first created a population-averaged brain using high-quality diffusion MRI datasets from the Human Connectome Project ,and then used sophisticated computational tools to delineate each bundle manually .
The tractography technique lets scientists visualize and quantitatively analyze the brain’s wiring patterns, complementing our understanding of how the brain functions. Such methods are especially useful to learn about the organization of deep-brain areas that remain out of reach for scientists using current tools and imaging techniques.
Reference:
[1] Kernel regression estimation of fiber orientation mixtures in diffusion MRI. Cabeen RP, Bastin ME, Laidlaw DH. Neuroimage. 2016 Feb 15;127:158-172.
Links:
Arthur Toga (USC Mark and Mary Stevens Neuroimaging and Informatics Institute, Los Angeles)
Ryan Cabeen (USC Mark and Mary Stevens Neuroimaging and Informatics Institute)
qitwiki—Information about the Quantitative Imaging Toolkit (USC)
Human Connectome Project (USC)
Show Us Your Brain Contest! (BRAIN Initiative/NIH)
Brain Research through Advancing Innovative Neurotechnologies® (BRAIN) Initiative (NIH)
NIH Support: National Institute of Neurological Disorders and Stroke; National Institute of Mental Health
Cool Videos: Starring the Wiring Diagram of the Human Brain
Posted on by Dr. Francis Collins

The human brain contains distinct geographic regions that communicate throughout the day to process information, such as remembering a neighbor’s name or deciding which road to take to work. Key to such processing is a vast network of densely bundled nerve fibers called tracts. It’s estimated that there are thousands of these tracts, and, because the human brain is so tightly packed with cells, they often travel winding, contorted paths to form their critical connections. That situation has previously been difficult for researchers to image three-dimensional tracts in the brain of a living person.
That’s now changing with a new approach called tractography, which is shown with the 3D data visualization technique featured in this video. Here, researchers zoom in and visualize some of the neural connections detected with tractography that originate or terminate near the hippocampus, which is a region of the brain essential to learning and memory. If you’re wondering about what the various colors represent, they indicate a tract’s orientation within the brain: side to side is red, front to back is green, and top to bottom is blue.