Brain Research through Advancing Innovative Neurotechnologies Initiative
An Inflammatory View of Early Alzheimer’s Disease
Posted on by Lawrence Tabak, D.D.S., Ph.D.
Detecting the earliest signs of Alzheimer’s disease (AD) in middle-aged people and tracking its progression over time in research studies continue to be challenging. But it is easier to do in shorter-lived mammalian models of AD, especially when paired with cutting-edge imaging tools that look across different regions of the brain. These tools can help basic researchers detect telltale early changes that might point the way to better prevention or treatment strategies in humans.
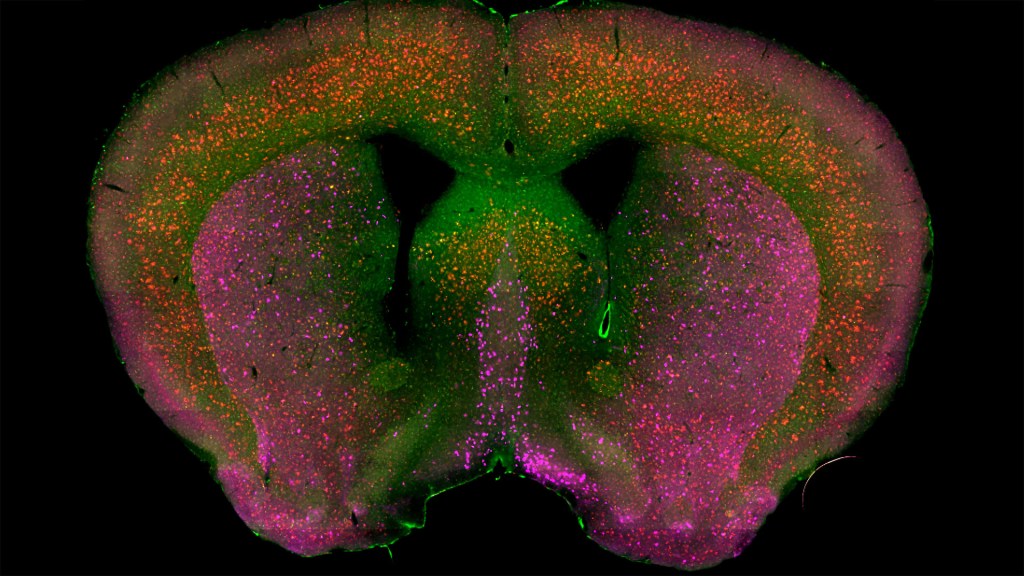
That’s the case in this technicolor snapshot showing early patterns of inflammation in the brain of a relatively young mouse bred to develop a condition similar to AD. You can see abnormally high levels of inflammation throughout the front part of the brain (orange, green) as well as in its middle part—the septum that divides the brain’s two sides. This level of inflammation suggests that the brain has been injured.
What’s striking is that no inflammation is detectable in parts of the brain rich in cholinergic neurons (pink), a distinct type of nerve cell that helps to control memory, movement, and attention. Though these neurons still remain healthy, researchers would like to know if the inflammation also will destroy them as AD progresses.
This colorful image comes from medical student Sakar Budhathoki, who earlier worked in the NIH labs of Lorna Role and David Talmage, National Institute of Neurological Disorders and Stroke (NINDS). Budhathoki, teaming with postdoctoral scientist Mala Ananth, used a specially designed wide-field scanner that sweeps across brain tissue to light up fluorescent markers and capture the image. It’s one of the scanning approaches pioneered in the Role and Talmage labs [1,2].
The two NIH labs are exploring possible links between abnormal inflammation and damage to the brain’s cholinergic signaling system. In fact, medications that target cholinergic function remain the first line of treatment for people with AD and other dementias. And yet, researchers still haven’t adequately determined when, why, and how the loss of these cholinergic neurons relates to AD.
It’s a rich area of basic research that offers hope for greater understanding of AD in the future. It’s also the source of some fascinating images like this one, which was part of the 2022 Show Us Your BRAIN! Photo and Video Contest, supported by NIH’s Brain Research Through Advancing Innovative Neurotechnologies® (BRAIN) Initiative.
References:
[1] NeuRegenerate: A framework for visualizing neurodegeneration. Boorboor S, Mathew S, Ananth M, Talmage D, Role LW, Kaufman AE. IEEE Trans Vis Comput Graph. 2021;Nov 10;PP.
[2] NeuroConstruct: 3D reconstruction and visualization of neurites in optical microscopy brain images. Ghahremani P, Boorboor S, Mirhosseini P, Gudisagar C, Ananth M, Talmage D, Role LW, Kaufman AE. IEEE Trans Vis Comput Graph. 2022 Dec;28(12):4951-4965.
Links:
Alzheimer’s Disease & Related Dementias (National Institute on Aging/NIH)
Role Lab (National Institute of Neurological Disorders and Stroke/NIH)
Talmage Lab (NINDS)
The Brain Research Through Advancing Innovative Neurotechnologies® (BRAIN) Initiative (NIH)
Show Us Your BRAINs! Photo and Video Contest (BRAIN Initiative)
NIH Support: National Institute of Neurological Disorders and Stroke
The Amazing Brain: Where Thoughts Trigger Body Movement
Posted on by Lawrence Tabak, D.D.S., Ph.D.

You’re looking at a section of a mammalian motor cortex (left), the part of the brain where thoughts trigger our body movements. Part of the section is also shown (right) in higher resolution to help you see the intricate details.
These views are incredibly detailed, and they also can’t be produced on a microscope or any current state-of-the-art imaging device. They were created on a supercomputer. Researchers input vast amounts of data covering the activity of the motor cortex to model this highly detailed and scientifically accurate digital simulation.
The vertical section (left) shows a circuit within a column of motor neurons. The neurons run from the top, where the brain meets the skull, downward to the point that the motor cortex connects with other brain areas.
The various colors represent different layers of the motor cortex, and the bright spots show where motor neurons are firing. Notice the thread-like extensions of the motor neurons, some of which double back to connect cells from one layer with others some distance away. All this back and forth makes it appear as though the surface is unraveling.
This unique imaging was part of this year’s Show Us Your Brain Photo and Video contest, supported by NIH’s Brain Research through Advancing Innovative Neurotechnologies® (BRAIN) Initiative. Nicolas Antille, an expert in turning scientific data into accurate and compelling visuals, created the images using a scientific model developed in the lab of Salvador Dura-Bernal, SUNY Downstate Health Sciences University, Brooklyn, NY. In the Dura-Bernal lab, scientists develop software and highly detailed computational models of neural circuits to better understand how they give rise to different brain functions and behavior [1].
Antille’s images make the motor neurons look densely packed, but in life the density would be five times as much. Antille has paused the computer simulation at a resolution that he found scientifically and visually interesting. But the true interconnections among neurons, or circuits, inside a real brain—even a small portion of a real brain—are more complex than the most powerful computers today can fully process.
While Antille is invested in revealing brain circuits as close to reality as possible, he also has the mind of an artist. He works with the subtle interaction of light with these cells to show how many individual neurons form this much larger circuit. Here’s more of his artistry at work. Antille wants to invite us all to ponder—even if only for a few moments—the wondrous beauty of the mammalian brain, including this remarkable place where thoughts trigger movements.
Reference:
[1] NetPyNE, a tool for data-driven multiscale modeling of brain circuits. Dura-Bernal S, Suter BA, Gleeson P, Cantarelli M, Quintana A, Rodriguez F, Kedziora DJ, Chadderdon GL, Kerr CC, Neymotin SA, McDougal RA, Hines M, Shepherd GM, Lytton WW. Elife. 2019 Apr 26;8:e44494.
Links:
Dura-Bernal Lab (State University of New York Downstate, Brooklyn)
Brain Research through Advancing Innovative Neurotechnologies® (BRAIN) Initiative (NIH)
Show Us Your BRAINs Photo & Video Contest (BRAIN Initiative)
NIH Support: National Institute of Biomedical Imaging and Bioengineering; National Institute of Neurological Disorders and Stroke; BRAIN Initiative
The Amazing Brain: Tight-Knit Connections
Posted on by Lawrence Tabak, D.D.S., Ph.D.
You’ve likely seen pictures of a human brain showing its smooth, folded outer layer, known as the cerebral cortex. Maybe you’ve also seen diagrams highlighting some of the brain’s major internal, or subcortical, structures.
These familiar representations, however, overlook the brain’s intricate internal wiring that power our thoughts and actions. This wiring consists of tightly bundled neural projections, called fiber tracts, that connect different parts of the brain into an integrated neural communications network.
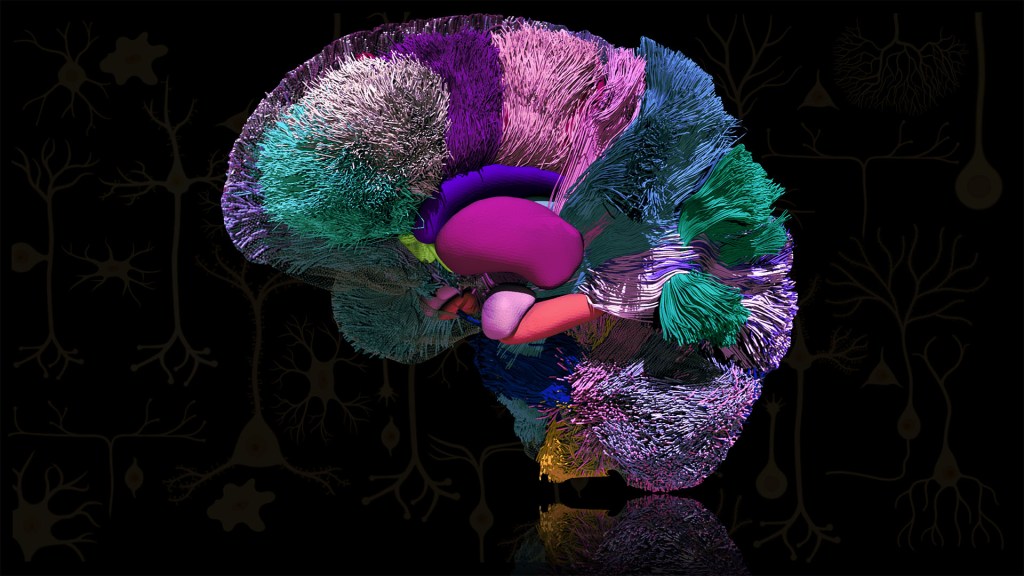
The actual patterns of these fiber tracts are represented here and serve as the featured attraction in this award-winning image from the 2022 Show Us Your BRAINs Photo and Video contest. The contest is supported by NIH’s Brain Research through Advancing Innovative Neurotechnologies® (BRAIN) Initiative.
Let’s take a closer look. At the center of the brain, you see some of the major subcortical structures: hippocampus (orange), amygdala (pink), putamen (magenta), caudate nucleus (purple), and nucleus accumbens (green). The fiber tracts are presented as colorful, yarn-like projections outside of those subcortical and other brain structures. The various colors, like a wiring diagram, distinguish the different fiber tracts and their specific connections.
This award-winning atlas of brain connectivity comes from Sahar Ahmad, Ye Wu, and Pew-Thian Yap, The University of North Carolina, Chapel Hill. The UNC Chapel Hill team produced this image using a non-invasive technique called diffusion MRI tractography. It’s an emerging approach with many new possibilities for neuroscience and the clinic [1]. Ahmad’s team is putting it to work to map the brain’s many neural connections and how they change across the human lifespan.
In fact, the connectivity atlas you see here isn’t from a single human brain. It’s actually a compilation of images of the brains of multiple 30-year-olds. The researchers are using this brain imaging approach to visualize changes in the brain and its fiber tracts as people grow, develop, and mature from infancy into old age.
Sahar says their comparisons of such images show that early in life, many dynamic changes occur in the brain’s fiber tracts. Once a person reaches young adulthood, the connective wiring tends to stabilize until old age, when fiber tracts begin to break down. These and other similarly precise atlases of the human brain promise to reveal fascinating insights into brain organization and the functional dynamics of its architecture, now and in the future.
Reference:
[1] Diffusion MRI fiber tractography of the brain. Jeurissen B, Descoteaux M, Mori S, Leemans A. NMR Biomed. 2019 Apr;32(4):e3785.
Links:
Brain Basics: Know Your Brain (National Institute of Neurological Disorders and Stroke/NIH)
Sahar Ahmad (The University of North Carolina, Chapel Hill)
Ye Wu (The University of North Carolina, Chapel Hill)
Pew-Thian Yap (The University of North Carolina, Chapel Hill)
Brain Research through Advancing Innovative Neurotechnologies® (BRAIN) Initiative (NIH)
Show Us Your BRAINs Photo & Video Contest (BRAIN Initiative)
NIH Support: BRAIN Initiative; National Institute of Mental Health
The Amazing Brain: Seeing Two Memories at Once
Posted on by Lawrence Tabak, D.D.S., Ph.D.

The NIH’s Brain Research Through Advancing Innovative Neurotechnologies® (BRAIN) Initiative is revolutionizing our understanding of the human brain. As described in the initiative’s name, the development of innovative imaging technologies will enable researchers to see the brain in new and increasingly dynamic ways. Each year, the initiative celebrates some standout and especially creative examples of such advances in the “Show Us Your BRAINs! Photo & Video Contest. During most of August, I’ll share some of the most eye-catching developments in our blog series, The Amazing Brain.
In this fascinating image, you’re seeing two stored memories, which scientists call engrams, in the hippocampus region of a mouse’s brain. The engrams show the neural intersection of a good memory (green) and a bad memory (pink). You can also see the nuclei of many neurons (blue), including nearby neurons not involved in the memory formation.
This award-winning image was produced by Stephanie Grella in the lab of NIH-supported neuroscientist Steve Ramirez, Boston University, MA. It’s also not the first time that the blog has featured Grella’s technical artistry. Grella, who will soon launch her own lab at Loyola University, Chicago, previously captured what a single memory looks like.
To capture two memories at once, Grella relied on a technology known as optogenetics. This powerful method allows researchers to genetically engineer neurons and selectively activate them in laboratory mice using blue light. In this case, Grella used a harmless virus to label neurons involved in recording a positive experience with a light-sensitive molecule, known as an opsin. Another molecular label was used to make those same cells appear green when activated.
After any new memory is formed, there’s a period of up to about 24 hours during which the memory is malleable. Then, the memory tends to stabilize. But with each retrieval, the memory can be modified as it restabilizes, a process known as memory reconsolidation.
Grella and team decided to try to use memory reconsolidation to their advantage to neutralize an existing fear. To do this, they placed their mice in an environment that had previously startled them. When a mouse was retrieving a fearful memory (pink), the researchers activated with light associated with the positive memory (green), which for these particular mice consisted of positive interactions with other mice. The aim was to override or disrupt the fearful memory.
As shown by the green all throughout the image, the experiment worked. While the mice still showed some traces of the fearful memory (pink), Grella explained that the specific cells that were the focus of her study shifted to the positive memory (green).
What’s perhaps even more telling is that the evidence suggests the mice didn’t just trade one memory for another. Rather, it appears that activating a positive memory actually suppressed or neutralized the animal’s fearful memory. The hope is that this approach might one day inspire methods to help people overcome negative and unwanted memories, such as those that play a role in post-traumatic stress disorder (PTSD) and other mental health issues.
Links:
Stephanie Grella (Boston University, MA)
Ramirez Group (Boston University)
Brain Research through Advancing Innovative Neurotechnologies® (BRAIN) Initiative (NIH)
Show Us Your BRAINs Photo & Video Contest (BRAIN Initiative)
NIH Support: BRAIN Initiative; Common Fund
Groundbreaking Study Maps Key Brain Circuit
Posted on by Dr. Francis Collins
Biologists have long wondered how neurons from different regions of the brain actually interconnect into integrated neural networks, or circuits. A classic example is a complex master circuit projecting across several regions of the vertebrate brain called the basal ganglia. It’s involved in many fundamental brain processes, such as controlling movement, thought, and emotion.
In a paper published recently in the journal Nature, an NIH-supported team working in mice has created a wiring diagram, or connectivity map, of a key component of this master circuit that controls voluntary movement. This groundbreaking map will guide the way for future studies of the basal ganglia’s direct connections with the thalamus, which is a hub for information going to and from the spinal cord, as well as its links to the motor cortex in the front of the brain, which controls voluntary movements.
This 3D animation drawn from the paper’s findings captures the biological beauty of these intricate connections. It starts out zooming around four of the six horizontal layers of the motor cortex. At about 6 seconds in, the video focuses on nerve cell projections from the thalamus (blue) connecting to cortex nerve cells that provide input to the basal ganglia (green). It also shows connections to the cortex nerve cells that input to the thalamus (red).
At about 25 seconds, the video scans back to provide a quick close-up of the cell bodies (green and red bulges). It then zooms out to show the broader distribution of nerve cells within the cortex layers and the branched fringes of corticothalamic nerve cells (red) at the top edge of the cortex.
The video comes from scientific animator Jim Stanis, University of Southern California Mark and Mary Stevens Neuroimaging and Informatics Institute, Los Angeles. He collaborated with Nick Foster, lead author on the Nature paper and a research scientist in the NIH-supported lab of Hong-Wei Dong at the University of California, Los Angeles.
The two worked together to bring to life hundreds of microscopic images of this circuit, known by the unusually long, hyphenated name: the cortico-basal ganglia-thalamic loop. It consists of a series of subcircuits that feed into a larger signaling loop.
The subcircuits in the loop make it possible to connect thinking with movement, helping the brain learn useful sequences of motor activity. The looped subcircuits also allow the brain to perform very complex tasks such as achieving goals (completing a marathon) and adapting to changing circumstances (running uphill or downhill).
Although scientists had long assumed the cortico-basal ganglia-thalamic loop existed and formed a tight, closed loop, they had no real proof. This new research, funded through NIH’s Brain Research Through Advancing Innovative Neurotechnologies® (BRAIN) Initiative, provides that proof showing anatomically that the nerve cells physically connect, as highlighted in this video. The research also provides electrical proof through tests that show stimulating individual segments activate the others.
Detailed maps of neural circuits are in high demand. That’s what makes results like these so exciting to see. Researchers can now better navigate this key circuit not only in mice but other vertebrates, including humans. Indeed, the cortico-basal ganglia-thalamic loop may be involved in a number of neurological and neuropsychiatric conditions, including Huntington’s disease, Parkinson’s disease, schizophrenia, and addiction. In the meantime, Stanis, Foster, and colleagues have left us with a very cool video to watch.
Reference:
[1] The mouse cortico-basal ganglia-thalamic network. Foster NN, Barry J, Korobkova L, Garcia L, Gao L, Becerra M, Sherafat Y, Peng B, Li X, Choi JH, Gou L, Zingg B, Azam S, Lo D, Khanjani N, Zhang B, Stanis J, Bowman I, Cotter K, Cao C, Yamashita S, Tugangui A, Li A, Jiang T, Jia X, Feng Z, Aquino S, Mun HS, Zhu M, Santarelli A, Benavidez NL, Song M, Dan G, Fayzullina M, Ustrell S, Boesen T, Johnson DL, Xu H, Bienkowski MS, Yang XW, Gong H, Levine MS, Wickersham I, Luo Q, Hahn JD, Lim BK, Zhang LI, Cepeda C, Hintiryan H, Dong HW. Nature. 2021;598(7879):188-194.
Links:
Brain Basics: Know Your Brain (National Institute of Neurological Disorders and Stroke/NIH)
Dong Lab (University of California, Los Angeles)
Mark and Mary Stevens Neuroimaging and Informatics Institute (University of Southern California, Los Angeles)
The Brain Research Through Advancing Innovative Neurotechnologies® (BRAIN) Initiative (NIH)
NIH Support: Eunice Kennedy Shriver National Institute of Child Health and Human Development; National Institute on Deafness and Other Communication Disorders; National Institute of Mental Health
Precision Deep Brain Stimulation Shows Initial Promise for Severe Depression
Posted on by Dr. Francis Collins

For many people struggling with depression, antidepressants and talk therapy can help to provide relief. But for some, the treatments don’t help nearly enough. I’m happy to share some early groundbreaking research in alleviating treatment-resistant depression in a whole new way: implanting a pacemaker-like device capable of delivering therapeutic electrical impulses deep into the brain, aiming for the spot where they can reset the depression circuit.
What’s so groundbreaking about the latest approach—so far, performed in just one patient—is that the electrodes didn’t simply deliver constant electrical stimulation. The system could recognize the specific pattern of brain activity associated with the patient’s depressive symptoms and deliver electrical impulses to the brain circuit where it could provide the most relief.
While much more study is needed, this precision approach to deep brain stimulation (DBS) therapy offered immediate improvement to the patient, a 36-year-old woman who’d suffered from treatment-resistant major depressive disorder since childhood. Her improvement has lasted now for more than a year.
This precision approach to DBS has its origins in clinical research supported through NIH’s Brain Research Through Advancing Innovative Neurotechnologies® (BRAIN) Initiative. A team, led by Edward Chang, a neurosurgeon at the University of California San Francisco’s (UCSF) Epilepsy Center, discovered while performing DBS that the low mood in some patients with epilepsy before surgery was associated with stronger activity in a “subnetwork” deep within the brain’s neural circuitry. The subnetwork involved crosstalk between the brain’s amygdala, which mediates fear and other emotions, and the hippocampus, which aids in memory.
Researchers led by Andrew Krystal, UCSF, Weill Institute for Neurosciences, attempted in the latest work to translate this valuable lead into improved care for depression. Their results were published recently in the journal Nature Medicine [1].
Krystal and colleagues, including Chang and Katherine Scangos, who is the first author of the new study, began by mapping patterns of brain activity in the patient that was associated with the onset of her low moods. They then customized an FDA-approved DBS device to respond only when it recognized those specific patterns. Called NeuroPace® RNS®, the device includes a small neurostimulator and measures about 6 by 3 centimeters, allowing it to be fully implanted inside a person’s skull. There, it continuously monitors brain activity and can deliver electrical stimulation via two leads, as shown in the image above [2].
Researchers found they could detect and predict high symptom severity best in the amygdala, as previously reported. The next question was where the electrical stimulation would best relieve those troubling brain patterns and associated symptoms. They discovered that stimulation in the brain’s ventral capsule/ventral striatum, part of the brain’s circuitry for decision-making and reward-related behavior, led to the most consistent and sustained improvements. Based on these findings, the team devised an on-demand and immediate DBS therapy that was unique to the patient’s condition.
It will be important to learn whether this precision approach to DBS is broadly effective for managing treatment-resistant depression and perhaps other psychiatric conditions. It will take much more study and time before such an approach to treating depression can become more widely available. Also, it is not yet clear just how much it would cost. But these remarkable new findings certainly point the way toward a promising new approach that will hopefully one day bring another treatment option for those in need of relief from severe depression.
References:
[1] Closed-loop neuromodulation in an individual with treatment-resistant depression. Scangos KW, Khambhati AN, Daly PM, Makhoul GS, Sugrue LP, Zamanian H, Liu TX, Rao VR, Sellers KK, Dawes HE, Starr PA, Krystal AD, Chang EF. Nat Med. 2021 Oct;27(10):1696-1700
[2] The NeuroPace® RNS® System for responsive neurostimulation, NIH BRAIN Initiative.
Links:
Depression (National Institute of Mental Health/NIH)
Deep Brain Stimulation for Parkinson’s Disease and other Movement Disorders (National Institute of Neurological Disorders and Stroke/NIH)
Andrew Krystal (University of California San Francisco)
Katherine Scangos (UCSF)
Edward Chang (UCSF)
NIH Support: National Institute of Neurological Disorders and Stroke
First Comprehensive Census of Cell Types in Brain Area Controlling Movement
Posted on by Dr. Francis Collins

The primary motor cortex is the part of the brain that enables most of our skilled movements, whether it’s walking, texting on our phones, strumming a guitar, or even spiking a volleyball. The region remains a major research focus, and that’s why NIH’s Brain Research Through Advancing Innovative Neurotechnologies® (BRAIN) Initiative – Cell Census Network (BICCN) has just unveiled two groundbreaking resources: a complete census of cell types present in the mammalian primary motor cortex, along with the first detailed atlas of the region, located along the back of the frontal lobe in humans (purple stripe above).
This remarkably comprehensive work, detailed in a flagship paper and more than a dozen associated articles published in the journal Nature, promises to vastly expand our understanding of the primary motor cortex and how it works to keep us moving [1]. The papers also represent the collaborative efforts of more than 250 BICCN scientists from around the world, teaming up over many years.
Started in 2013, the BRAIN Initiative is an ambitious project with a range of groundbreaking goals, including the creation of an open-access reference atlas that catalogues all of the brain’s many billions of cells. The primary motor cortex was one of the best places to get started on assembling an atlas because it is known to be well conserved across mammalian species, from mouse to human. There’s also a rich body of work to aid understanding of more precise cell-type information.
Taking advantage of recent technological advances in single-cell analysis, the researchers categorized into different types the millions of neurons and other cells in this brain region. They did so on the basis of morphology, or shape, of the cells, as well as their locations and connections to other cells. The researchers went even further to characterize and sort cells based on: their complex patterns of gene expression, the presence or absence of chemical (or epigenetic) marks on their DNA, the way their chromosomes are packaged into chromatin, and their electrical properties.
The new data and analyses offer compelling evidence that neural cells do indeed fall into distinct types, with a high degree of correspondence across their molecular genetic, anatomical, and physiological features. These findings support the notion that neural cells can be classified into molecularly defined types that are also highly conserved or shared across mammalian species.
So, how many cell types are there? While that’s an obvious question, it doesn’t have an easy answer. The number varies depending upon the method used for sorting them. The researchers report that they have identified about 25 classes of cells, including 16 different neuronal classes and nine non-neuronal classes, each composed of multiple subtypes of cells.
These 25 classes were determined by their genetic profiles, their locations, and other characteristics. They also showed up consistently across species and using different experimental approaches, suggesting that they have important roles in the neural circuitry and function of the motor cortex in mammals.
Still, many precise features of the cells don’t fall neatly into these categories. In fact, by focusing on gene expression within single cells of the motor cortex, the researchers identified more potentially important cell subtypes, which fall into roughly 100 different clusters, or distinct groups. As scientists continue to examine this brain region and others using the latest new methods and approaches, it’s likely that the precise number of recognized cell types will continue to grow and evolve a bit.
This resource will now serve as a springboard for future research into the structure and function of the brain, both within and across species. The datasets already have been organized and made publicly available for scientists around the world.
The atlas also now provides a foundation for more in-depth study of cell types in other parts of the mammalian brain. The BICCN is already engaged in an effort to generate a brain-wide cell atlas in the mouse, and is working to expand coverage in the atlas for other parts of the human brain.
The cell census and atlas of the primary motor cortex are important scientific advances with major implications for medicine. Strokes commonly affect this region of the brain, leading to partial or complete paralysis of the opposite side of the body.
By considering how well cell census information aligns across species, scientists also can make more informed choices about the best models to use for deepening our understanding of brain disorders. Ultimately, these efforts and others underway will help to enable precise targeting of specific cell types and to treat a wide range of brain disorders that affect thinking, memory, mood, and movement.
Reference:
[1] A multimodal cell census and atlas of the mammalian primary motor cortex. BRAIN Initiative Cell Census Network (BICCN). Nature. Oct 6, 2021.
Links:
NIH Brain Research Through Advancing Innovative Neurotechnologies® (BRAIN) Initiative (NIH)
BRAIN Initiative – Cell Census Network (BICCN) (NIH)
NIH Support: National Institute of Mental Health; National Institute of Neurological Disorders and Stroke
The Amazing Brain: Motor Neurons of the Cervical Spine
Posted on by Dr. Francis Collins
Today, you may have opened a jar, done an upper body workout, played a guitar or a piano, texted a friend, or maybe even jotted down a grocery list longhand. All of these “skilled” arm, wrist, and hand movements are made possible by the bundled nerves, or circuits, running through a part of the central nervous system in the neck area called the cervical spine.
This video, which combines sophisticated imaging and computation with animation, shows the density of three types of nerve cells in the mouse cervical spine. There are the V1 interneurons (red), which sit between sensory and motor neurons; motor neurons associated with controlling the movement of the bicep (blue); and motor neurons associated with controlling the tricep (green).
At 4 seconds, the 3D animation morphs to show all the colors and cells intermixed as they are naturally in the cervical spine. At 8 seconds, the animation highlights the density of these three cells types. Notice in the bottom left corner, a light icon appears indicating the different imaging perspectives. What’s unique here is the frontal, or rostral, view of the cervical spine. The cervical spine is typically imaged from a lateral, or side, perspective.
Starting at 16 seconds, the animation highlights the location and density of each of the individual neurons. For the grand finale, viewers zoom off on a brief fly-through of the cervical spine and a flurry of reds, blues, and greens.
The video comes from Jamie Anne Mortel, a research assistant in the lab of Samuel Pfaff, Salk Institute, La Jolla, CA. Mortel is part of a team supported by the NIH-led Brain Research through Advancing Innovative Neurotechnologies® (BRAIN) Initiative that’s developing a comprehensive atlas of the circuitry within the cervical spine that controls how mice control their forelimb movements, such as reaching and grasping.
This basic research will provide a better understanding of how the mammalian brain and spinal cord work together to produce movement. More than that, this research may provide valuable clues into better treating paralysis to arms, wrists, and/or hands caused by neurological diseases and spinal cord injuries.
As a part of this project, the Pfaff lab has been busy developing a software tool to take their imaging data from different parts of the cervical spine and present it in 3D. Mortel, who likes to make cute cartoon animations in her spare time, noticed that the software lacked animation capability. So she took the initiative and spent the next three weeks working after hours to produce this video—her first attempt at scientific animation. No doubt she must have been using a lot of wrist and hand movements!
With a positive response from her Salk labmates, Mortel decided to enter her scientific animation debut in the 2021 Show Us BRAINs! Photo and Video Contest. To her great surprise and delight, Mortel won third place in the video competition. Congratulations, and continued success for you and the team in producing this much-needed atlas to define the circuitry underlying skilled arm, wrist, and hand movements.
Links:
Brain Research through Advancing Innovative Neurotechnologies® (BRAIN) Initiative (NIH)
Spinal Cord Injury Information Page (National Institute of Neurological Disorders and Stroke/NIH)
Samuel Pfaff (Salk Institute, La Jolla, CA)
Show Us Your BRAINs! Photo and Video Contest (Brain Initiative/NIH)
NIH Support: National Institute of Neurological Disorders and Stroke
The Amazing Brain: Tracking Molecular Events with Calling Cards
Posted on by Dr. Francis Collins
In days mostly gone by, it was fashionable in some circles for people to hand out calling cards to mark their arrival at special social events. This genteel human tradition is now being adapted to the lab to allow certain benign viruses to issue their own high-tech calling cards and mark their arrival at precise locations in the genome. These special locations show where there’s activity involving transcription factors, specialized proteins that switch genes on and off and help determine cell fate.
The idea is that myriad, well-placed calling cards can track brain development over time in mice and detect changes in transcription factor activity associated with certain neuropsychiatric disorders. This colorful image, which won first place in this year’s Show Us Your BRAINs! Photo and Video contest, provides a striking display of these calling cards in action in living brain tissue.
The image comes from Allen Yen, a PhD candidate in the lab of Joseph Dougherty, collaborating with the nearby lab of Rob Mitra. Both labs are located in the Washington University School of Medicine, St. Louis.
Yen and colleagues zoomed in on this section of mouse brain tissue under a microscope to capture dozens of detailed images that they then stitched together to create this high-resolution overview. The image shows neural cells (red) and cell nuclei (blue). But focus in on the neural cells (green) concentrated in the brain’s outer cortex (top) and hippocampus (two lobes in the upper center). They’ve been labelled with calling cards that were dropped off by adeno-associated virus [1].
Once dropped off, a calling card doesn’t bear a pretentious name or title. Rather, the calling card, is a small mobile snippet of DNA called a transposon. It gets dropped off with the other essential component of the technology: a specialized enzyme called a transposase, which the researchers fuse to one of many specific transcription factors of interest.
Each time one of these transcription factors of interest binds DNA to help turn a gene on or off, the attached transposase “grabs” a transposon calling card and inserts it into the genome. As a result, it leaves behind a permanent record of the interaction.
What’s also nice is the calling cards are programmed to give away their general locations. That’s because they encode a fluorescent marker (in this image, it’s a green fluorescent protein). In fact, Yen and colleagues could look under a microscope and tell from all the green that their calling card technology was in place and working as intended.
The final step, though, was to find out precisely where in the genome those calling cards had been left. For this, the researchers used next-generation sequencing to produce a cumulative history and map of each and every calling card dropped off in the genome.
These comprehensive maps allow them to identify important DNA-protein binding events well after the fact. This innovative technology also enables scientists to attribute past molecular interactions with observable developmental outcomes in a way that isn’t otherwise possible.
While the Mitra and Dougherty labs continue to improve upon this technology, it’s already readily adaptable to answer many important questions about the brain and brain disorders. In fact, Yen is now applying the technology to study neurodevelopment in mouse models of neuropsychiatric disorders, specifically autism spectrum disorder (ASD) [2]. This calling card technology also is available for any lab to deploy for studying a transcription factor of interest.
This research is supported by the Brain Research through Advancing Innovative Neurotechnologies® (BRAIN) Initiative. One of the major goals of BRAIN Initiative is to accelerate the development and application of innovative technologies to gain new understanding of the brain. This award-winning image is certainly a prime example of striving to meet this goal. I’ll look forward to what these calling cards will tell us in the future about ASD and other important neurodevelopmental conditions affecting the brain.
References:
[1] A viral toolkit for recording transcription factor-DNA interactions in live mouse tissues. Cammack AJ, Moudgil A, Chen J, Vasek MJ, Shabsovich M, McCullough K, Yen A, Lagunas T, Maloney SE, He J, Chen X, Hooda M, Wilkinson MN, Miller TM, Mitra RD, Dougherty JD. Proc Natl Acad Sci U S A. 2020 May 5;117(18):10003-10014.
[2] A MYT1L Syndrome mouse model recapitulates patient phenotypes and reveals altered brain development due to disrupted neuronal maturation. Jiayang Chen, Mary E. Lambo, Xia Ge, Joshua T. Dearborn, Yating Liu, Katherine B. McCullough, Raylynn G. Swift, Dora R. Tabachnick, Lucy Tian, Kevin Noguchi, Joel R. Garbow, John N. Constantino. bioRxiv. May 27, 2021.
Links:
Brain Research through Advancing Innovative Neurotechnologies® (BRAIN) Initiative (NIH)
Autism Spectrum Disorder (National Institute of Mental Health/NIH)
Dougherty Lab (Washington University School of Medicine, St. Louis)
Mitra Lab (Washington University School of Medicine)
Show Us Your BRAINs! Photo and Video Contest (BRAIN Initiative/NIH)
NIH Support: National Institute of Neurological Disorders and Stroke; National Institute of Mental Health; National Center for Advancing Translational Sciences; National Human Genome Research Institute; National Institute of General Medical Sciences
The Amazing Brain: A Sharper Image of the Pyramidal Tract
Posted on by Dr. Francis Collins
Flip the image above upside down, and the shape may remind you of something. If you think it resembles a pyramid, then you and a lot of great neuroscientists are thinking alike. What you are viewing is a colorized, 3D reconstruction of a pyramidal tract, which are bundles of nerve fibers that originate from the brain’s cerebral cortex and relay signals to the brainstem or the spinal cord. These signals control many important activities, including the voluntary movement of our arms, legs, head, and face.
For a while now, it’s been possible to combine a specialized form of magnetic resonance imaging (MRI) with computer modeling tools to produce 3D reconstructions of complicated networks of nerve fibers, such as the pyramidal tract. Still, for technical reasons, the quality of these reconstructions has remained poor in parts of the brain where nerve fibers cross at angles of 40 degrees or less.
The video above demonstrates how adding a sophisticated algorithm, called Orientation Distribution Function (ODF)-Fingerprinting, to such modeling can help overcome this problem when reconstructing a pyramidal tract. It has potential to enhance the reliability of these 3D reconstructions as neurosurgeons begin to use them to plan out their surgeries to help ensure they are carried out with the utmost safety and precision.
In the first second of the video, you see gray, fuzzy images from a diffusion MRI of the pyramidal tract. But, very quickly, a more colorful, detailed 3D reconstruction begins to appear, swiftly filling in from the top down. Colors are used to indicate the primary orientations of the nerve fibers: left to right (red), back to front (green), and top to bottom (blue). The orange, magenta, and other colors represent combinations of these primary directional orientations.
About three seconds into the video, a rough draft of the 3D reconstruction is complete. The top of the pyramidal tract looks pretty good. However, looking lower down, you can see distortions in color and relatively poor resolution of the nerve fibers in the middle of the tract—exactly where the fibers cross each other at angles of less than 40 degrees. So, researchers tapped into the power of their new ODF-Fingerprinting software to improve the image—and, starting about nine seconds into the video, you can see an impressive final result.
The researchers who produced this amazing video are Patryk Filipiak and colleagues in the NIH-supported lab of Steven Baete, Center for Advanced Imaging Innovation and Research, New York University Grossman School of Medicine, New York. The work paired diffusion MRI data from the NIH Human Connectome Project with the ODF-Fingerprinting algorithm, which was created by Baete to incorporate additional MRI imaging data on the shape of nerve fibers to infer their directionality [1].
This innovative approach to imaging recently earned Baete’s team second place in the 2021 “Show Us Your BRAINs” Photo and Video contest, sponsored by the NIH-led Brain Research through Advancing Innovative Neurotechnologies® (BRAIN) Initiative. But researchers aren’t stopping there! They are continuing to refine ODF-Fingerprinting, with the aim of modeling the pyramidal tract in even higher resolution for use in devising new and better ways of helping people undergoing neurosurgery.
Reference:
[1] Fingerprinting Orientation Distribution Functions in diffusion MRI detects smaller crossing angles. Baete SH, Cloos MA, Lin YC, Placantonakis DG, Shepherd T, Boada FE. Neuroimage. 2019 Sep;198:231-241.
Links:
Brain Research through Advancing Innovative Neurotechnologies® (BRAIN) Initiative (NIH)
Human Connectome Project (University of Southern California, Los Angeles)
Steven Baete (Center for Advanced Imaging Innovation and Research, New York University Grossman School of Medicine, New York)
Show Us Your BRAINs! Photo and Video Contest (BRAIN Initiative/NIH)
NIH Support: National Institute of Biomedical Imaging and Bioengineering; National Institute of Neurological Disorders and Stroke; National Cancer Institute
Next Page