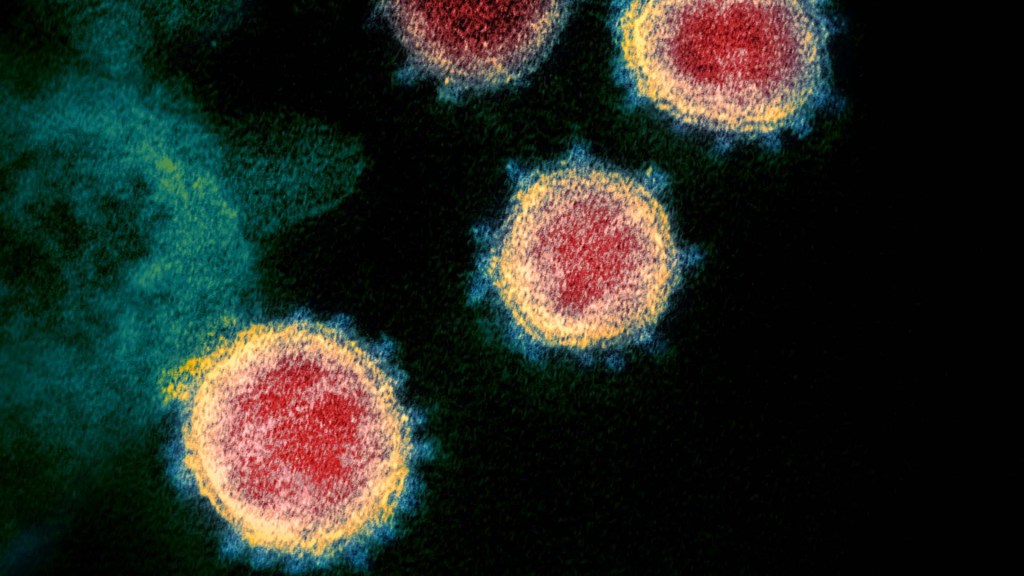
COVID-19 infections
How One Change to The Coronavirus Spike Influences Infectivity
Posted on by Lawrence Tabak, D.D.S., Ph.D.
Since joining NIH, I’ve held a number of different leadership positions. But there is one position that thankfully has remained constant for me: lab chief. I run my own research laboratory at NIH’s National Institute of Dental and Craniofacial Research (NIDCR).
My lab studies a biochemical process called O-glycosylation. It’s fundamental to life and fascinating to study. Our cells are often adorned with a variety of carbohydrate sugars. O-glycosylation refers to the biochemical process through which these sugar molecules, either found at the cell surface or secreted, get added to proteins. The presence or absence of these sugars on certain proteins plays fundamental roles in normal tissue development and first-line human immunity. It also is associated with various diseases, including cancer.
Our lab recently joined a team of NIH scientists led by my NIDCR colleague Kelly Ten Hagen to demonstrate how O-glycosylation can influence SARS-CoV-2, the coronavirus that causes COVID-19, and its ability to fuse to cells, which is a key step in infecting them. In fact, our data, published in the journal Proceedings of the National Academy of Sciences, indicate that some variants, seem to have mutated to exploit the process to their advantage [1].
The work builds on the virus’s reliance on the spike proteins that crown its outer surface to attach to human cells. Once there, the spike protein must be activated to fuse and launch an infection. That happens when enzymes produced by our own cells make a series of cuts, or cleavages, to the spike protein.
The first cut comes from an enzyme called furin. We and others had earlier evidence that O-glycosylation can affect the way furin makes those cuts. That got us thinking: Could O-glycosylation influence the interaction between furin and the spike protein? The furin cleavage area of the viral spike was indeed adorned with sugars, and their presence or absence might influence spike activation by furin.
We also noticed the Alpha and Delta variants carry a mutation that removes the amino acid proline in a specific spot. That was intriguing because we knew from earlier work that enzymes called GALNTs, which are responsible for adding bulky sugar molecules to proteins, prefer prolines near O-glycosylation sites.
It also suggested that loss of proline in the new variants could mean decreased O-glycosylation, which might then influence the degree of furin cleavage and SARS-CoV-2’s ability to enter cells. I should note that the recent Omicron variant was not examined in the current study.
After detailed studies in fruit fly and mammalian cells, we demonstrated in the original SARS-CoV-2 virus that O-glycosylation of the spike protein decreases furin cleavage. Further experiments then showed that the GALNT1 enzyme adds sugars to the spike protein and this addition limits the ability of furin to make the needed cuts and activate the spike protein.
Importantly, the spike protein change found in the Alpha and Delta variants lowers GALNT1 activity, making it easier for furin to start its activating cuts. It suggests that glycosylation of the viral spike by GALNT1 may limit infection with the original virus, and that the Alpha and Delta variant mutation at least partially overcomes this effect, to potentially make the virus more infectious.
Building on these studies, our teams looked for evidence of GALNT1 in the respiratory tracts of healthy human volunteers. We found that the enzyme is indeed abundantly expressed in those cells. Interestingly, those same cells also express the ACE2 receptor, which SARS-CoV-2 depends on to infect human cells.
It’s also worth noting here that the Omicron variant carries the very same spike mutation that we studied in Alpha and Delta. Omicron also has another nearby change that might further alter O-glycosylation and cleavage of the spike protein by furin. The Ten Hagen lab is looking into these leads to learn how this region in Omicron affects spike glycosylation and, ultimately, the ability of this devastating virus to infect human cells and spread.
Reference:
[1] Furin cleavage of the SARS-CoV-2 spike is modulated by O-glycosylation. Zhang L, Mann M, Syed Z, Reynolds HM, Tian E, Samara NL, Zeldin DC, Tabak LA, Ten Hagen KG. PNAS. 2021 Nov 23;118(47).
Links:
COVID-19 Research (NIH)
Kelly Ten Hagen (National Institute of Dental and Craniofacial Research/NIH)
Lawrence Tabak (NIDCR)
NIH Support: National Institute of Dental and Craniofacial Research
Breakthrough Infections Occur in Those with Lower Antibody Levels, Israeli Study Shows
Posted on by Dr. Francis Collins
To see how COVID-19 vaccines are working in the real world, Israel has provided particularly compelling data. The fact that Israel is relatively small, keeps comprehensive medical records, and has a high vaccination rate with a single vaccine (Pfizer) has contributed to its robust data collection. Now, a new Israeli study offers some insight into those relatively uncommon breakthrough infections. It confirms that breakthrough cases, as might be expected, arise most often in individuals with lower levels of neutralizing antibodies.
The findings reported in The New England Journal of Medicine focused on nearly 1,500 of about 11,500 fully vaccinated health care workers at Sheba Medical Center, Ramat Gan, Israel [1]. All had received two doses of the Pfizer mRNA vaccine. But, from December 19, 2020 to April 28, 2021, they were tested for a breakthrough infection due to a known exposure to someone with COVID-19 or possible symptoms of the disease.
Just 39 confirmed breakthrough cases were found, indicating a breakthrough infection rate of just 0.4 percent. That’s consistent with rates reported in previous studies. Most in the Israeli study who tested positive for COVID-19 had mild or no symptoms and none required hospitalization.
In the new study, researchers led by Gili Regev-Yochay at Sheba Medical Center’s Infection Control and Prevention Unit, characterized as many breakthrough infections as possible among the health care workers. Almost half of the infections involved members of the hospital nursing staff. But breakthrough cases also were found in hospital administration, maintenance workers, doctors, and other health professionals.
The average age of someone with a breakthrough infection was 42, and it’s notable that only one person was known to have a weakened immune system. The most common symptoms were respiratory congestion, muscle aches (myalgia), and loss of smell or taste. Most didn’t develop a fever. At six weeks after diagnosis, 19 percent reported having symptoms of Long COVID syndrome, including prolonged loss of smell, persistent cough, weakness, and fatigue. About a quarter stayed home from work for longer than the required 10 days, and one had yet to return to work at six weeks.
For 22 of the 39 people with a breakthrough infection, the researchers had results of neutralizing antibody tests from the week leading up to their positive COVID-19 test result. To look for patterns in the antibody data, they matched those individuals to 104 uninfected people for whom they also had antibody test results. These data showed that those with a breakthrough infection had consistently lower levels of neutralizing antibodies circulating in their bloodstream to SARS-CoV-2, the coronavirus that causes COVID-19. In general, higher levels of neutralizing antibodies are associated with greater protection and lower infectivity—though other aspects of the immune system (memory B cells and cell-mediated immunity) also contribute.
Importantly, in all cases for which there were relevant data, the source of the breakthrough infection was thought to be an unvaccinated person. In fact, more than half of those who developed a breakthrough infection appeared to have become infected from an unvaccinated member of their own household.
Other cases were suspected to arise from exposure to an unvaccinated coworker or patient. Contact tracing found no evidence that any of the 39 health care workers with a breakthrough infection passed it on to anyone else.
The findings add to evidence that full vaccination and associated immunity offer good protection against SARS-CoV-2 infection and severe illness. Understanding how SARS-CoV-2 immunity changes over time is key for charting the course of this pandemic and making important decisions about COVID-19 vaccine boosters.
Many questions remain. For instance, it’s not clear from the study whether lower neutralizing antibodies in those with breakthrough cases reflect waning immunity or, for reasons we don’t yet understand, those individuals may have had a more limited immune response to the vaccine. Also, this study was conducted before the Delta variant became dominant in Israel (and now in the whole world).
Overall, these findings provide more reassurance that these vaccines are extremely effective. Breakthrough infections, while they can and do occur, are a relatively uncommon event. Here in the U.S., the Centers for Disease Control and Prevention (CDC) has recently estimated that infection is six times less likely for vaccinated than unvaccinated persons [2]. That those with immunity tend to have mild or no symptoms if they do develop a breakthrough case, however, is a reminder that these cases could easily be missed, and they could put vulnerable populations at greater risk. It’s yet another reason for all those who can to get themselves vaccinated as soon as possible or consider a booster shot when they become eligible.
References:
[1] Covid-19 breakthrough infections in vaccinated health care workers. Bergwerk M, Gonen T, Lustig Y, Amit S, Lipsitch M, Cohen C, Mandelboim M, Levin EG, Rubin C, Indenbaum V, Tal I, Zavitan M, Zuckerman N, Bar-Chaim A, Kreiss Y, Regev-Yochay G. N Engl J Med. 2021 Oct 14;385(16):1474-1484.
[2] Rates of COVID-19 cases and deaths by vaccination status, COVID Data Tracker, Centers for Disease and Prevention. Accessed October 25, 2021.
Links:
COVID-19 Research (NIH)
Sheba Medical Center (Ramat Gan, Israel)
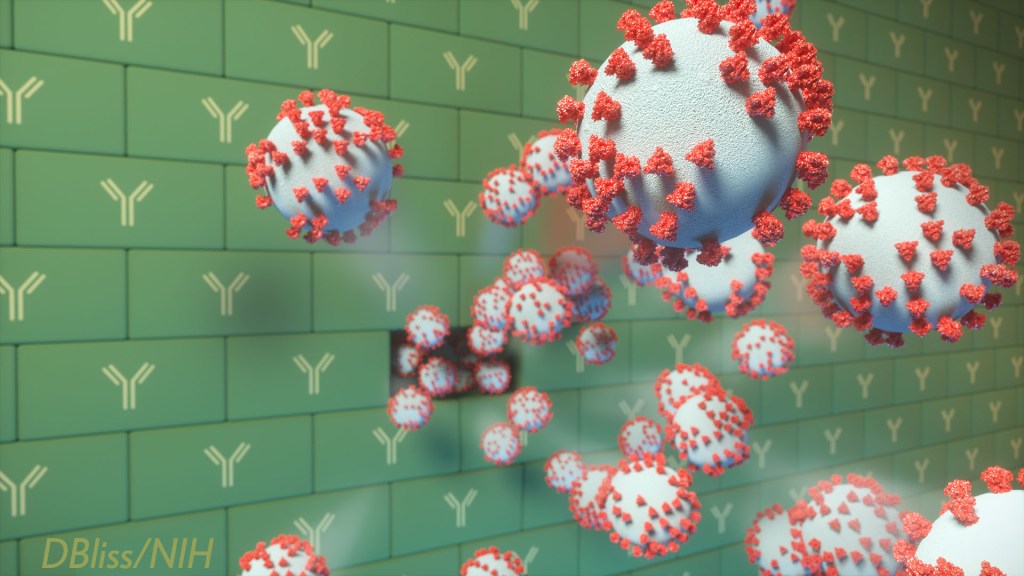
COVID-19 Vaccines Protect the Family, Too
Posted on by Dr. Francis Collins

Any of the available COVID-19 vaccines offer remarkable personal protection against the coronavirus SARS-CoV-2. So, it also stands to reason that folks who are vaccinated will reduce the risk of spreading the virus to family members within their households. That protection is particularly important when not all family members can be immunized—as when there are children under age 12 or adults with immunosuppression in the home. But just how much can vaccines help to protect families from COVID-19 when only some, not all, in the household have immunity?
A Swedish study, published recently in the journal JAMA Internal Medicine, offers some of the first hard figures on this topic, and the findings are quite encouraging [1]. The data show that people without any immunity against COVID-19 were at considerably lower risk of infection and hospitalization when other members of their family had immunity, either from a natural infection or vaccination. In fact, the protective effect on family members went up as the number of immune family members increased.
The findings come from a team led by Peter Nordström, Umeå University, Sweden. Like in the United States, vaccinations in Sweden initially were prioritized for high-risk groups and people with certain preexisting conditions. As a result, Swedish families have functioned, often in close contact, as a mix of immune and susceptible individuals over the course of the pandemic.
To explore these family dynamics in greater detail, the researchers relied on nationwide registries to identify all Swedes who had immunity to SARS-COV-2 from either a confirmed infection or vaccination by May 26, 2021. The researchers identified more than 5 million individuals who’d been either diagnosed with COVID-19 or vaccinated and then matched them to a control group without immunity. They also limited the analysis to individuals in families with two to five members of mixed immune status.
This left them with about 1.8 million people from more than 800,000 families. The situation in Sweden is also a little unique from most Western nations. Somewhat controversially, the Swedish government didn’t order a mandatory citizen quarantine to slow the spread of the virus.
The researchers found in the data a rising protective effect for those in the household without immunity as the number of immune family members increased. Families with one immune family member had a 45 to 61 percent lower risk of a COVID-19 infection in the home than those who had none. Those with two immune family members enjoyed more protection, with a 75 to 86 percent reduction in risk of COVID-19. For those with three or four immune family members, the protection went up to more than 90 percent, topping out at 97 percent protection. The results were similar when the researchers limited the analysis to COVID-19 illnesses serious enough to warrant a hospital stay.
The findings confirm that vaccination is incredibly important not only for individual protection, but also for reducing transmission, especially within families and those with whom we’re in close physical contact. It’s also important to note that the findings apply to the original SARS-CoV-2 variant, which was dominant when the study was conducted. But we know that the vaccines offer good protection against Delta and other variants of concern.
These results show quite clearly that vaccines offer protection for individuals who lack immunity, with important implications for finally ending this pandemic. This doesn’t change the fact that all those who can and still need to get fully vaccinated should do so as soon as possible. If you are eligible for a booster shot, that’s something to consider, too. But, if for whatever reason you haven’t gotten vaccinated just yet, perhaps these new findings will encourage you to do it now for the sake of those other people you care about. This is a chance to love your family—and love your neighbor.
Reference:
[1] Association between risk of COVID-19 infection in nonimmune individuals and COVID-19 immunity in their family members. Nordström P, Ballin M, Nordström A. JAMA Intern Med. 2021 Oct 11.
Links:
COVID-19 Research (NIH)
Peter Nordström (Umeå University, Sweden)
COVID-19 Infected Many More Americans in 2020 than Official Tallies Show
Posted on by Dr. Francis Collins
At the end of last year, you may recall hearing news reports that the number of COVID-19 cases in the United States had topped 20 million. While that number came as truly sobering news, it also likely was an underestimate. Many cases went undetected due to limited testing early in the year and a large number of infections that produced mild or no symptoms.
Now, a recent article published in Nature offers a more-comprehensive estimate that puts the true number of infections by the end of 2020 at more than 100 million [1]. That’s equal to just under a third of the U.S. population of 328 million. This revised number shows just how rapidly this novel coronavirus spread through the country last year. It also brings home just how timely the vaccines have been—and continue to be in 2021—to protect our nation’s health in this time of pandemic.
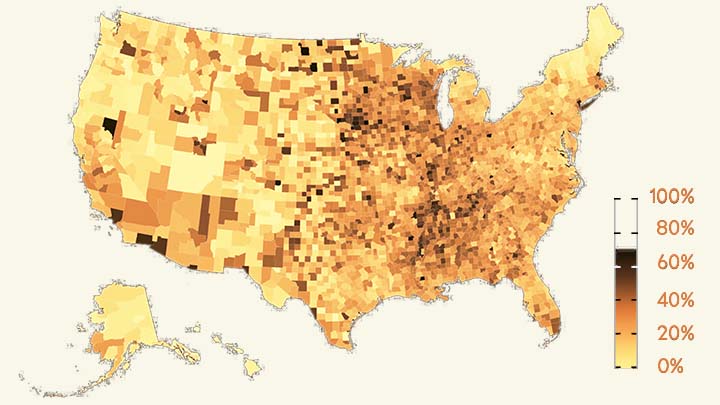
The work comes from NIH grantee Jeffrey Shaman, Sen Pei, and colleagues, Columbia University, New York. As shown above in the map, the researchers estimated the percentage of people who had been infected with SARS-CoV-2, the novel coronavirus that causes COVID-19, in communities across the country through December 2020.
To generate this map, they started with existing national data on the number of coronavirus cases (both detected and undetected) in 3,142 U.S. counties and major metropolitan areas. They then factored in data from the Centers for Disease Control and Prevention (CDC) on the number of people who tested positive for antibodies against SARS-CoV-2. These CDC data are useful for picking up on past infections, including those that went undetected.
From these data, the researchers calculated that only about 11 percent of all COVID-19 cases were confirmed by a positive test result in March 2020. By the end of the year, with testing improvements and heightened public awareness of COVID-19, the ascertainment rate (the number of infections that were known versus unknown) rose to about 25 percent on average. This measure also varied a lot across the country. For instance, the ascertainment rates in Miami and Phoenix were higher than the national average, while rates in New York City, Los Angeles, and Chicago were lower than average.
How many people were potentially walking around with a contagious SARS-CoV-2 infection? The model helps to answer this, too. On December 31, 2020, the researchers estimate that 0.77 percent of the U.S. population had a contagious infection. That’s about 1 in every 130 people on average. In some places, it was much higher. In Los Angeles, for example, nearly 1 in 40 (or 2.42 percent) had a SARS-CoV-2 infection as they rang in the New Year.
Over the course of the year, the fatality rate associated with COVID-19 dropped, at least in part due to earlier diagnosis and advances in treatment. The fatality rate went from 0.77 percent in April to 0.31 percent in December. While this is great news, it still shows that COVID-19 remains much more dangerous than seasonal influenza (which has a fatality rate of 0.08 percent).
Today, the landscape has changed considerably. Vaccines are now widely available, giving many more people immune protection without ever having to get infected. And yet, the rise of the Delta and other variants means that breakthrough infections and reinfections—which the researchers didn’t account for in their model—have become a much bigger concern.
Looking ahead to the end of 2021, Americans must continue to do everything they can to protect their communities from the spread of this terrible virus. That means getting vaccinated if you haven’t already, staying home and getting tested if you’ve got symptoms or know of an exposure, and taking other measures to keep yourself and your loved ones safe and well. These measures we take now will influence the infection rates and susceptibility to SARS-CoV-2 in our communities going forward. That will determine what the map of SARS-CoV-2 infections will look like in 2021 and beyond and, ultimately, how soon we can finally put this pandemic behind us.
Reference:
[1] Burden and characteristics of COVID-19 in the United States during 2020. Pei S, Yamana TK, Kandula S, Galanti M, Shaman J. Nature. 2021 Aug 26.
Links:
COVID-19 Research (NIH)
Sen Pei (Columbia University, New York)
Jeffrey Shaman (Columbia University, New York)
New Metric Identifies Coronavirus Hotspots in Real Time
Posted on by Dr. Francis Collins

During the pandemic, it’s been critical to track in real time where the coronavirus is spreading at home and abroad. But it’s often hard for public health officials to know whether changes in the reported number of COVID-19 cases over time truly reflect the spread of the virus or whether they are confounded by changes in testing levels or lags in the reporting of results.
Now, NIH-funded researchers have discovered a clever workaround to detect more accurately where COVID-19 hotspots are emerging. As published in the journal Science, the new approach focuses on the actual amount of virus present in a positive COVID diagnostic test [1], not just whether the test is positive or negative. What’s even better is these data on a person’s “viral load” are readily available from polymerase chain reaction, or PCR, tests that are the “gold standard” for detecting SARS-CoV-2, the virus responsible for COVID-19. In fact, if you’ve been tested for COVID-19, there’s a good chance you’ve had a PCR-based test.
Here’s how a PCR test for COVID-19 works. After a person provides a nasal swab or saliva sample, any genetic material in the sample is extracted and prepared for the PCR machine. It uses special nucleic acid primers that, if any genetic material from SARS-CoV-2 is present, will make millions more copies of them and result in a positive test result. PCR is an enzymatic reaction that works by running many cycles of heating and cooling; each cycle results in doubling of the genetic material present in the original sample.
But it turns out that PCR can go beyond a simple “yes” or “no” test result. It’s also possible to get some sense of how much coronavirus is present in a positive sample based on the number of cycles required to make enough copies of its genetic material to get the “yes” result. This measure is known as the “cycle threshold,” or Ct, value.
When a sample is run with lots of virus in it, the PCR machine doesn’t need to make so many cycles to reach detectable levels—and the Ct value is considered low. But, when the virus is barely present in a sample, the machine needs to run more cycles before it will reach the threshold for detection. In this case, the Ct value is high. This makes the Ct metric a bit counterintuitive: low Ct means a high level of infection, and high Ct means a low level of infection.
In the new study, researchers in Michael Mina’s lab, Harvard T. H. Chan School of Public Health, Boston, including James Hay and Lee Kennedy-Shaffer, wanted to use Ct values to understand better the overall trajectory of the spread of SARS-CoV-2. Their idea was a little out of the box, since Ct values weren’t being factored into a diagnostic testing process that was set up to give people a yes-or-no answer about COVID-19 status. In fact, Ct values were often discarded.
The team members had a hunch that the amount of virus in patient samples would vary based on whether an outbreak is increasing or declining. Their reasoning was that during an outbreak, when SARS-CoV-2 is spreading rapidly through a community, a larger proportion of infected individuals will have recently contracted the virus than when it is spreading more slowly. The researchers also knew that the virus reaches its peak level in humans soon after infection (generally a couple of days before symptoms begin), and then falls to very low but still detectable levels over the course of weeks or sometimes even months. So, when viral load within samples is highest—and Ct values are lowest—it suggests an outbreak of SARS-CoV-2 is underway. As an outbreak slows and cases fall, viral loads should fall and Ct values rise.
The researchers found that just 30 positive PCR test results on a single day were enough to give an accurate real-time estimate of the growth rate of SARS-CoV-2 infections based on Ct values. With Ct values from multiple time points, it was possible to reconstruct the epidemic curve and estimate the true number of people infected. They found that even Ct values collected from a single location at a single point in time could provide extremely valuable information about the growth or decline of an outbreak.
The findings suggest that these data can now be captured and put to good use as a key metric for decision-making and gauging the success of the pandemic response going forward. It’s also important to note that the value of these data are not unique to COVID-19 and the ongoing pandemic. It appears this can be extremely useful new way to monitor the course of other viral outbreaks, now and in the future, in a way that’s less susceptible to the vagaries of testing. The hope is that this will mean even greater success in capturing viral outbreaks and mobilizing resources in real time to the places where they are most needed.
Reference:
[1] Estimating epidemiologic dynamics from cross-sectional viral load distributions. Hay JA, Kennedy-Shaffer L, Kanjilal S, Lennon NJ, Gabriel SB, Lipsitch M, Mina MJ. Science. 2021 Jun 3.
Links:
COVID-19 Research (NIH)
Michael Mina (Harvard T. H. Chan School of Public Health, Boston)
NIH Support: Common Fund, National Institute of General Medical Sciences; National Cancer Institute
How Immunity Generated from COVID-19 Vaccines Differs from an Infection
Posted on by Dr. Francis Collins
A key issue as we move closer to ending the pandemic is determining more precisely how long people exposed to SARS-CoV-2, the COVID-19 virus, will make neutralizing antibodies against this dangerous coronavirus. Finding the answer is also potentially complicated with new SARS-CoV-2 “variants of concern” appearing around the world that could find ways to evade acquired immunity, increasing the chances of new outbreaks.
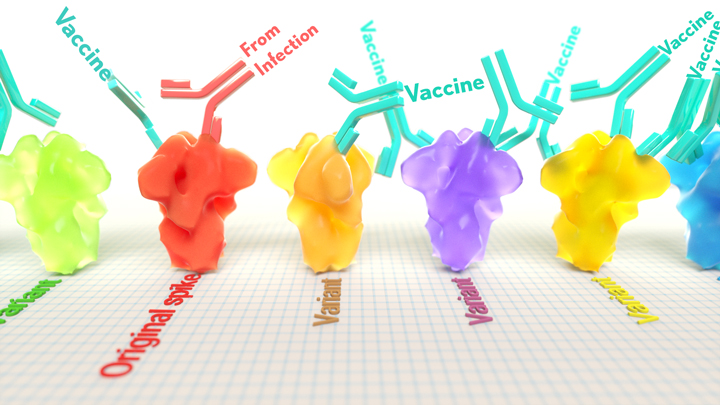
Now, a new NIH-supported study shows that the answer to this question will vary based on how an individual’s antibodies against SARS-CoV-2 were generated: over the course of a naturally acquired infection or from a COVID-19 vaccine. The new evidence shows that protective antibodies generated in response to an mRNA vaccine will target a broader range of SARS-CoV-2 variants carrying “single letter” changes in a key portion of their spike protein compared to antibodies acquired from an infection.
These results add to evidence that people with acquired immunity may have differing levels of protection to emerging SARS-CoV-2 variants. More importantly, the data provide further documentation that those who’ve had and recovered from a COVID-19 infection still stand to benefit from getting vaccinated.
These latest findings come from Jesse Bloom, Allison Greaney, and their team at Fred Hutchinson Cancer Research Center, Seattle. In an earlier study, this same team focused on the receptor binding domain (RBD), a key region of the spike protein that studs SARS-CoV-2’s outer surface. This RBD is especially important because the virus uses this part of its spike protein to anchor to another protein called ACE2 on human cells before infecting them. That makes RBD a prime target for both naturally acquired antibodies and those generated by vaccines. Using a method called deep mutational scanning, the Seattle group’s previous study mapped out all possible mutations in the RBD that would change the ability of the virus to bind ACE2 and/or for RBD-directed antibodies to strike their targets.
In their new study, published in the journal Science Translational Medicine, Bloom, Greaney, and colleagues looked again to the thousands of possible RBD variants to understand how antibodies might be expected to hit their targets there [1]. This time, they wanted to explore any differences between RBD-directed antibodies based on how they were acquired.
Again, they turned to deep mutational scanning. First, they created libraries of all 3,800 possible RBD single amino acid mutants and exposed the libraries to samples taken from vaccinated individuals and unvaccinated individuals who’d been previously infected. All vaccinated individuals had received two doses of the Moderna mRNA vaccine. This vaccine works by prompting a person’s cells to produce the spike protein, thereby launching an immune response and the production of antibodies.
By closely examining the results, the researchers uncovered important differences between acquired immunity in people who’d been vaccinated and unvaccinated people who’d been previously infected with SARS-CoV-2. Specifically, antibodies elicited by the mRNA vaccine were more focused to the RBD compared to antibodies elicited by an infection, which more often targeted other portions of the spike protein. Importantly, the vaccine-elicited antibodies targeted a broader range of places on the RBD than those elicited by natural infection.
These findings suggest that natural immunity and vaccine-generated immunity to SARS-CoV-2 will differ in how they recognize new viral variants. What’s more, antibodies acquired with the help of a vaccine may be more likely to target new SARS-CoV-2 variants potently, even when the variants carry new mutations in the RBD.
It’s not entirely clear why these differences in vaccine- and infection-elicited antibody responses exist. In both cases, RBD-directed antibodies are acquired from the immune system’s recognition and response to viral spike proteins. The Seattle team suggests these differences may arise because the vaccine presents the viral protein in slightly different conformations.
Also, it’s possible that mRNA delivery may change the way antigens are presented to the immune system, leading to differences in the antibodies that get produced. A third difference is that natural infection only exposes the body to the virus in the respiratory tract (unless the illness is very severe), while the vaccine is delivered to muscle, where the immune system may have an even better chance of seeing it and responding vigorously.
Whatever the underlying reasons turn out to be, it’s important to consider that humans are routinely infected and re-infected with other common coronaviruses, which are responsible for the common cold. It’s not at all unusual to catch a cold from seasonal coronaviruses year after year. That’s at least in part because those viruses tend to evolve to escape acquired immunity, much as SARS-CoV-2 is now in the process of doing.
The good news so far is that, unlike the situation for the common cold, we have now developed multiple COVID-19 vaccines. The evidence continues to suggest that acquired immunity from vaccines still offers substantial protection against the new variants now circulating around the globe.
The hope is that acquired immunity from the vaccines will indeed produce long-lasting protection against SARS-CoV-2 and bring an end to the pandemic. These new findings point encouragingly in that direction. They also serve as an important reminder to roll up your sleeve for the vaccine if you haven’t already done so, whether or not you’ve had COVID-19. Our best hope of winning this contest with the virus is to get as many people immunized now as possible. That will save lives, and reduce the likelihood of even more variants appearing that might evade protection from the current vaccines.
Reference:
[1] Antibodies elicited by mRNA-1273 vaccination bind more broadly to the receptor binding domain than do those from SARS-CoV-2 infection. Greaney AJ, Loes AN, Gentles LE, Crawford KHD, Starr TN, Malone KD, Chu HY, Bloom JD. Sci Transl Med. 2021 Jun 8.
Links:
COVID-19 Research (NIH)
Bloom Lab (Fred Hutchinson Cancer Research Center, Seattle)
NIH Support: National Institute of Allergy and Infectious Diseases
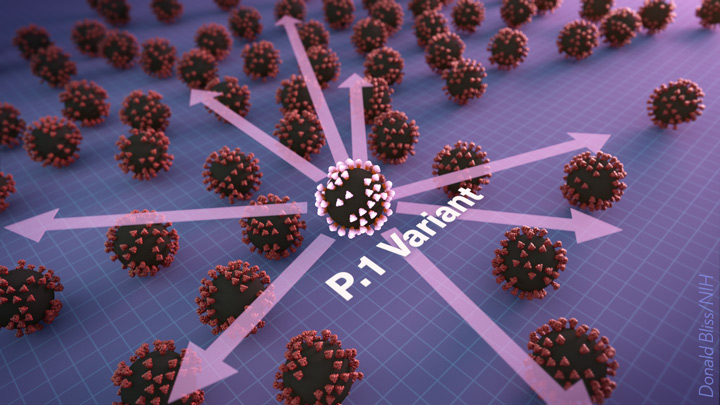
Tracking the Evolution of a ‘Variant of Concern’ in Brazil
Posted on by Dr. Francis Collins
By last October, about three out of every four residents of Manaus, Brazil already had been infected with SARS-CoV-2, the virus that causes COVID-19 [1]. And yet, despite hopes of achieving “herd immunity” in this city of 2.2 million in the Amazon region, the virus came roaring back in late 2020 and early 2021 to cause a second wave of illness and death [2]. How is this possible?
The answer offers a lesson in viral evolution, especially when an infectious virus such as SARS-CoV-2 replicates and spreads through a population largely unchecked. In a recent study in the journal Science, researchers tied the city’s resurgence of SARS-CoV-2 to the emergence and rapid spread of a new SARS-CoV-2 “variant of concern” known as P.1 [3]. This variant carries a unique constellation of mutations that allow it not only to sneak past the human immune system and re-infect people, but also to be about twice as transmissible as earlier variants.
To understand how this is possible, consider that each time the coronavirus SARS-CoV-2 makes copies of itself in an infected person, there’s a chance a mistake will be made. Each mistake can produce a new variant that may go on to make more copies of itself. In most cases, those random errors are of little to no consequence. This is evolution in action.
But sometimes a spelling change can occur that benefits the virus. In the special case of patients with suppressed immune systems, the virus can have ample opportunity to accrue an unusually high number of mutations. Variants carrying beneficial mutations can make more copies of themselves than other variants, allowing them to build their numbers and spread to cause more infection.
At this advanced stage of the COVID-19 pandemic, such rapidly spreading new variants remain cause for serious concern. That includes variants such as B.1.351, which originated in South Africa; B.1.1.7 which emerged in the United Kingdom; and now P.1 from Manaus, Brazil.
In the new study, Nuno Faria and Samir Bhatt, Imperial College London, U.K., and Ester Cerdeira Sabino, Universidade de Sao Paulo, Brazil, and their colleagues sequenced SARS-CoV-2 genomes from 184 patient samples collected in Manaus in November and December 2020. The research was conducted under the auspices of the Brazil-UK Centre for Arbovirus Discovery, Diagnosis, Genomics and Epidemiology (CADDE), a project focused on viral genomics and epidemiology for public health.
Those genomic data revealed the P.1 variant had acquired 17 new mutations. Ten were in the spike protein, which is the segment of the virus that binds onto human cells and the target of current COVID-19 vaccines. In fact, the new work reveals that three of these spike protein mutations make it easier for the P.1 spike to bind the human ACE2 receptor, which is SARS-CoV-2’s preferred entry point.
The first P.1 variant case was detected by genomic surveillance on December 6, 2020, after which it spread rapidly. Through further evolutionary analysis, the team estimates that P.1 must have emerged, undetected for a brief time, in mid-November 2020.
To understand better how the P.1 variant led to such an explosion of new COVID-19 cases, the researchers developed a mathematical model that integrated the genomic data with mortality data. The model suggests that P.1 may be 1.7 to 2.4 times more transmissible than earlier variants. They also estimate that a person previously infected with a variant other than P.1 will have only 54 percent to 79 percent protection against a subsequent infection with P.1.
The researchers also observed an increase in mortality following the emergence of the P.1 variant. However, it’s not yet clear if that’s an indication P.1 is inherently more deadly than earlier variants. It’s possible the increased mortality is related primarily to the extra stress on the healthcare system in Manaus from treating so many people with COVID-19.
These findings are yet another reminder of the importance of genomic surveillance and international data sharing for detecting and characterizing emerging SARS-CoV-2 variants quickly. It’s worth noting that at about the same time this variant was detected in Brazil, it also was reported in four individuals who had traveled to Brazil from Japan. The P.1 variant continues to spread rapidly across Brazil. It has also been detected in more than 37 countries [4], including the United States, where it now accounts for more than 1 percent of new cases [5].
No doubt you are wondering what this means for vaccines, such as the Pfizer and Moderna mRNA vaccines, that have been used to immunize (at least one dose) over 140 million people in the United States. Here the news is encouraging. Serum from individuals who received the Pfizer vaccine had titers of neutralizing antibodies that were only slightly reduced for P.1 compared to the original SARS-CoV-2 virus [6]. Therefore, the vaccine is predicted to be highly protective. This is another example of a vaccine providing more protection than a natural infection.
The United States has made truly remarkable progress in combating COVID-19, but we must heed this lesson from Manaus: this terrible pandemic isn’t over just yet. While the P.1 variant remains at low levels here for now, the “U.K. variant” B.1.1.7 continues to spread rapidly and now is the most prevalent variant circulating in the U.S., accounting for 44 percent of new cases [6]. Fortunately, the mRNA vaccines also work well against B.1.1.7.
We must continue to do absolutely everything possible, individually and collectively, to prevent these new SARS-CoV-2 variants from slowing or even canceling the progress made over the last year. We need to remain vigilant for just a while longer, while encouraging our friends, neighbors, and loved ones to get vaccinated.
References:
[1] Three-quarters attack rate of SARS-CoV-2 in the Brazilian Amazon during a largely unmitigated epidemic. Buss, L. F., C. A. Prete, Jr., C. M. M. Abrahim, A. C. Dye, V. H. Nascimento, N. R. Faria and E. C. Sabino et al. (2021). Science 371(6526): 288-292.
[2] Resurgence of COVID-19 in Manaus, Brazil, despite high seroprevalence. Sabino EC, Buss LF, Carvalho MPS, Prete Jr CCA, Crispim MAE, Fraiji NA, Pereira RHM, Paraga KV, Peixoto PS, Kraemer MUG, Oikawa MJ, Salomon T, Cucunuba ZM, Castro MC, Santos AAAS, Nascimento VH, Pereira HS, Ferguson NM, Pybus OG, Kucharski A, Busch MP, Dye C, Faria NR Lancet. 2021 Feb 6;397(10273):452-455.
[3] Genomics and epidemiology of the P.1 SARS-CoV-2 lineage in Manaus, Brazil. Faria NR, Mellan TA, Whittaker C, Claro IM, Fraiji NA, Carvalho MDPSS, Pybus OG, Flaxman S, Bhatt S, Sabino EC et al. Science. 2021 Apr 14:eabh2644.
[4] GRINCH Global Report Investigating novel coronavirus haplotypes. PANGO Lineages.
[5] COVID Data Tracker. Variant Proportions. Centers for Disease Control and Prevention.
[6] Antibody evasion by the P.1 strain of SARS-CoV-2. Dejnirattisai W, Zhou D, Supasa P, Liu C, Mongkolsapaya J, Ren J, Stuart DI, Screaton GR, et al. Cell. 2021 Mar 30:S0092-8674(21)00428-1.
Links:
COVID-19 Research (NIH)
Brazil-UK Centre for Arbovirus Discovery, Diagnosis, Genomics and Epidemiology (CADDE)
Nuno Faria (Imperial College, London, U.K.)
Samir Bhatt (Imperial College)
Ester Cerdeira Sabino (Universidade de Sao Paulo, Brazil)
NIH Support: National Institute of Allergy and Infectious Diseases
Taking a Closer Look at COVID-19’s Effects on the Brain
Posted on by Dr. Francis Collins

While primarily a respiratory disease, COVID-19 can also lead to neurological problems. The first of these symptoms might be the loss of smell and taste, while some people also may later battle headaches, debilitating fatigue, and trouble thinking clearly, sometimes referred to as “brain fog.” All of these symptoms have researchers wondering how exactly the coronavirus that causes COVID-19, SARS-CoV-2, affects the human brain.
In search of clues, researchers at NIH’s National Institute of Neurological Disorders and Stroke (NINDS) have now conducted the first in-depth examinations of human brain tissue samples from people who died after contracting COVID-19. Their findings, published in the New England Journal of Medicine, suggest that COVID-19’s many neurological symptoms are likely explained by the body’s widespread inflammatory response to infection and associated blood vessel injury—not by infection of the brain tissue itself [1].
The NIH team, led by Avindra Nath, used a high-powered magnetic resonance imaging (MRI) scanner (up to 10 times as sensitive as a typical MRI) to examine postmortem brain tissue from 19 patients. They ranged in age from 5 to 73, and some had preexisting conditions, such as diabetes, obesity, and cardiovascular disease.
The team focused on the brain’s olfactory bulb that controls our ability to smell and the brainstem, which regulates breathing and heart rate. Based on earlier evidence, both areas are thought to be highly susceptible to COVID-19.
Indeed, the MRI images revealed in both regions an unusual number of bright spots, a sign of inflammation. They also showed dark spots, which indicate bleeding. A closer look at the bright spots showed that tiny blood vessels in those areas were thinner than normal and, in some cases, leaked blood proteins into the brain. This leakage appeared to trigger an immune reaction that included T cells from the blood and the brain’s scavenging microglia. The dark spots showed a different pattern, with leaky vessels and clots but no evidence of an immune reaction.
While those findings are certainly interesting, perhaps equally noteworthy is what Nath and colleagues didn’t see in those samples. They could find no evidence in the brain tissue samples that SARS-CoV-2 had invaded the brain tissue. In fact, several methods to detect genetic material or proteins from the virus all turned up empty.
The findings are especially intriguing because there has been some suggestion based on studies in mice that SARS-CoV-2 might cross the blood-brain barrier and invade the brain. Indeed, a recent report by NIH-funded researchers in Nature Neuroscience showed that the viral spike protein, when injected into mice, readily entered the brain along with many other organs [2].
Another recent report in the Journal of Experimental Medicine, which used mouse and human brain tissue, suggests that SARS-CoV-2 may indeed directly infect the central nervous system, including the brain [3]. In autopsies of three people who died from complications of COVID-19, the NIH-supported researchers detected signs of SARS-CoV-2 in neurons in the brain’s cerebral cortex. This work was done using the microscopy-based technique of immunohistochemistry, which uses antibodies to bind to a target, in this case, the virus’s spike protein. Also last month, in a study published in the journal Neurobiology of Disease, another NIH-supported team demonstrated in a series of experiments in cell culture that the SARS-CoV-2 spike protein could cross a 3D model of the blood-brain barrier and infect the endothelial cells that line blood vessels in the brain [4].
Clearly, more research is needed, and NIH’s National Institute of Neurological Disorders and Stroke has just launched the COVID-19 Neuro Databank/Biobank (NeuroCOVID) to collect more clinical information, primarily about COVID-19-related neurological symptoms, complications, and outcomes. Meanwhile, Nath and colleagues continue to explore how COVID-19 affects the brain and triggers the neurological symptoms often seen in people with COVID-19. As we learn more about the many ways COVID-19 wreaks havoc on the body, understanding the neurological symptoms will be critical in helping people, including the so-called Long Haulers bounce back from this terrible viral infection.
References:
[1] Microvascular Injury in the Brains of Patients with Covid-19. Lee MH, Perl DP, Nair G, Li W, Maric D, Murray H, Dodd SJ, Koretsky AP, Watts JA, Cheung V, Masliah E, Horkayne-Szakaly I, Jones R, Stram MN, Moncur J, Hefti M, Folkerth RD, Nath A. N Engl J Med. 2020 Dec 30.
[2] The S1 protein of SARS-CoV-2 crosses the blood-brain barrier in mice. Rhea EM, Logsdon AF, Hansen KM, Williams LM, Reed MJ, Baumann KK, Holden SJ, Raber J, Banks WA, Erickson MA. Nat Neurosci. 2020 Dec 16.
[3] Neuroinvasion of SARS-CoV-2 in human and mouse brain. Song E, Zhang C, Israelow B, et al. J Exp Med (2021) 218 (3): e20202135.
[4] The SARS-CoV-2 spike protein alters barrier function in 2D static and 3D microfluidic in-vitro models of the human blood-brain barrier. Buzhdygan TP, DeOre BJ, Baldwin-Leclair A, Bullock TA, McGary HM, Khan JA, Razmpour R, Hale JF, Galie PA, Potula R, Andrews AM, Ramirez SH. Neurobiol Dis. 2020 Dec;146:105131.
Links:
COVID-19 Research (NIH)
Avindra Nath (National Institute of Neurological Disorders and Stroke/NIH)
NIH Support: National Institute of Neurological Disorders and Stroke; National Institute on Aging; National Institute of General Medical Sciences; National Cancer Institute; National Institute of Mental Health
Study of Healthcare Workers Shows COVID-19 Immunity Lasts Many Months
Posted on by Dr. Francis Collins

Throughout the COVID-19 pandemic, healthcare workers around the world have shown willingness to put their own lives on the line for their patients and communities. Unfortunately, many have also contracted SARS-CoV-2, the coronavirus that causes of COVID-19, while caring for patients. That makes these frontline heroes helpful in another way in the fight against SARS-CoV-2: determining whether people who have recovered from COVID-19 can be reinfected by the virus.
New findings from a study of thousands of healthcare workers in England show that those who got COVID-19 and produced antibodies against the virus are highly unlikely to become infected again, at least over the several months that the study was conducted. In the rare instances in which someone with acquired immunity for SARS-CoV-2 subsequently tested positive for the virus within a six month period, they never showed any signs of being ill.
Some earlier studies have shown that people who survive a COVID-19 infection continue to produce protective antibodies against key parts of the virus for several months. But how long those antibodies last and whether they are enough to protect against reinfection have remained open questions.
In search of answers, researchers led by David Eyre, University of Oxford, England, looked to more than 12,000 healthcare workers at Oxford University Hospitals from April to November 2020. At the start of the study, 11,052 of them tested negative for antibodies against SARS-CoV-2, suggesting they hadn’t had COVID-19. But the other 1,246 tested positive for antibodies, evidence that they’d already been infected.
After this initial testing, all participants received antibody tests once every two months and diagnostic tests for an active COVID-19 infection at least every other week. What the researchers discovered was rather interesting. Eighty-nine of the 11,052 healthcare workers who tested negative at the outset later got a symptomatic COVID-19 infection. Another 76 individuals who originally tested negative for antibodies tested positive for COVID-19, despite having no symptoms.
Here’s the good news: Just three of these more than 1400 antibody-positive individuals subsequently tested positive for SARS-CoV-2. What’s more, not one of them had any symptoms of COVID-19.
The findings, which were posted as a pre-print on medRxiv, suggest that acquired immunity from an initial COVID-19 infection offers protection against reinfection for six months or maybe longer. Questions remain about whether the acquired immunity is due to the observed antibodies alone or their interplay with other immune cells. It will be important to continue to follow these healthcare workers even longer, to learn just how long their immune protection might last.
Meanwhile, more than 15 million people in the United States have now tested positive for COVID-19, leading to more than 285,000 deaths. Last week, the U.S. reported for the first time more than 200,000 new infections, with hospitalizations and deaths also on the rise.
While the new findings on reinfection come as good news to be sure, it’s important to remember that the vast majority of the 328 million Americans still remain susceptible to this life-threatening virus. So, throughout this holiday season and beyond—as we eagerly await the approval and widespread distribution of vaccines—we must all continue to do absolutely everything we can to protect ourselves, our loved ones, and our communities from COVID-19.
Reference:
[1] Antibodies to SARS-CoV-2 are associated with protection against reinfection. Lumley, S.F. et al. MedRxiv. 19 November 2020.
Links:
Coronavirus (COVID) (NIH)
Combat COVID (U.S. Department of Health and Human Services, Washington, D.C.)
David Eyre (University of Oxford, England)
Masks Save Lives
Posted on by Dr. Francis Collins
Reminding others that “masks save lives” isn’t just sound advice. It’s a scientific fact that wearing one in public can help to slow the spread of SARS-CoV-2, the virus responsible for the coronavirus disease 2019 (COVID-19) pandemic.
I’m very careful to wear a mask outside my home whenever I’m out and about. I do it not necessarily to protect myself, but to protect others. If by chance I’ve been exposed to the virus and am currently incubating it, I wouldn’t want to spread it to other people. And any of us could be an unknowing superspreader. We owe it to everyone we encounter, especially those who are more vulnerable, to protect them. As my NIH colleague Tony Fauci recently demonstrated, it’s possible to wear your mask even while you’re outside exercising.
But there are still skeptics around. So, just how much does a facial covering protect those around you? Quite a bit, according to researchers who created a sophisticated mathematical model to take a more detailed look [1]. Their model shows that even if a community universally adopted a crude cloth covering that’s far less than 100 percent protective against the virus, this measure alone could significantly help to reduce deaths.
These findings, funded partly by NIH, were published recently in Nature Communications. They come from Colin Worby, Broad Institute of MIT and Harvard, Cambridge, MA, and Hsiao-Han Chang, National Tsing Hua University, Taiwan.
The researchers noted several months ago that recommendations on wearing a mask varied across the United States and around the world. To help guide policymakers, the researchers simulated outbreaks in a closed, randomly interacting population in which the supply and effectiveness of crude cloth or disposable, medical-grade masks varied.
Under different outbreak scenarios and mask usages, the researchers calculated the total numbers of expected SARS-CoV-2 infections and deaths from COVID-19. Not surprisingly, they found that the total number of deaths and infections declined as the availability and effectiveness of face masks increased.
The researchers’ model primarily considered the distribution of medical-grade, surgical masks. But because such masks are currently available in limited supply, they must be prioritized for use by health care workers and others at high risk. The researchers go on to note that the World Health Organization and others now recommend wearing homemade face coverings in public, especially in places where the virus is spreading. While it’s true the ability of these face coverings to contain the virus is more limited than medical-grade masks, they can help and will lead to many fewer deaths.
Another recent paper also suggests that while wearing a mask is primarily intended to prevent the wearer from infecting others, it may also help lower the dose, or inoculum, of SARS-CoV-2 that the wearer might receive from others, resulting in milder or asymptomatic infections [2]. If correct, that’s another great reason to wear a mask.
Already, more than 175,000 people in the United States have died from COVID-19. The latest estimates [3] from the Institute for Health Metrics and Evaluation (IHME) at the University of Washington’s School of Medicine, Seattle, predict that the COVID-19 death toll in the U.S. may reach nearly 300,000 by December 1.
But that doesn’t have to happen. As this new study shows, face coverings—even those that are far from perfect—really can and do save lives. In fact, IHME data also show that consistent mask-wearing—starting today—could save close to 70,000 lives in the months to come. Saving those lives is up to all of us. Don’t leave home without your mask.
References:
[1] Face mask use in the general population and optimal resource allocation during the COVID-19 pandemic. Worby CJ, Chang HH. Nat Commun. 2020 Aug 13;11(1):4049.
[2] Masks Do More Than Protect Others During COVID-19: Reducing the Inoculum of SARS-CoV-2 to Protect the Wearer. Gandhi M, Beyrer C, Goosby E. J Gen Intern Med. 2020 Jul 31.
[3] New IHME COVID-19 forecasts see nearly 300,000 deaths by December 1. Institute for Health Metrics and Evaluation. August 6, 2020.
Links:
Coronavirus (COVID-19) (NIH)
Colin Worby (Broad Institute of MIT and Harvard, Cambridge, MA)
Hsiao-Han Chang (National Tsing Hua University, Taiwan)
NIH Support: National Institute of Allergy and Infectious Diseases