United States
COVID-19 Infected Many More Americans in 2020 than Official Tallies Show
Posted on by Dr. Francis Collins
At the end of last year, you may recall hearing news reports that the number of COVID-19 cases in the United States had topped 20 million. While that number came as truly sobering news, it also likely was an underestimate. Many cases went undetected due to limited testing early in the year and a large number of infections that produced mild or no symptoms.
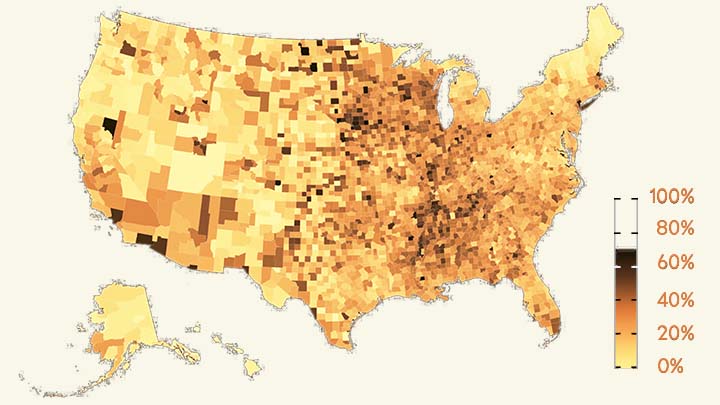
Now, a recent article published in Nature offers a more-comprehensive estimate that puts the true number of infections by the end of 2020 at more than 100 million [1]. That’s equal to just under a third of the U.S. population of 328 million. This revised number shows just how rapidly this novel coronavirus spread through the country last year. It also brings home just how timely the vaccines have been—and continue to be in 2021—to protect our nation’s health in this time of pandemic.
The work comes from NIH grantee Jeffrey Shaman, Sen Pei, and colleagues, Columbia University, New York. As shown above in the map, the researchers estimated the percentage of people who had been infected with SARS-CoV-2, the novel coronavirus that causes COVID-19, in communities across the country through December 2020.
To generate this map, they started with existing national data on the number of coronavirus cases (both detected and undetected) in 3,142 U.S. counties and major metropolitan areas. They then factored in data from the Centers for Disease Control and Prevention (CDC) on the number of people who tested positive for antibodies against SARS-CoV-2. These CDC data are useful for picking up on past infections, including those that went undetected.
From these data, the researchers calculated that only about 11 percent of all COVID-19 cases were confirmed by a positive test result in March 2020. By the end of the year, with testing improvements and heightened public awareness of COVID-19, the ascertainment rate (the number of infections that were known versus unknown) rose to about 25 percent on average. This measure also varied a lot across the country. For instance, the ascertainment rates in Miami and Phoenix were higher than the national average, while rates in New York City, Los Angeles, and Chicago were lower than average.
How many people were potentially walking around with a contagious SARS-CoV-2 infection? The model helps to answer this, too. On December 31, 2020, the researchers estimate that 0.77 percent of the U.S. population had a contagious infection. That’s about 1 in every 130 people on average. In some places, it was much higher. In Los Angeles, for example, nearly 1 in 40 (or 2.42 percent) had a SARS-CoV-2 infection as they rang in the New Year.
Over the course of the year, the fatality rate associated with COVID-19 dropped, at least in part due to earlier diagnosis and advances in treatment. The fatality rate went from 0.77 percent in April to 0.31 percent in December. While this is great news, it still shows that COVID-19 remains much more dangerous than seasonal influenza (which has a fatality rate of 0.08 percent).
Today, the landscape has changed considerably. Vaccines are now widely available, giving many more people immune protection without ever having to get infected. And yet, the rise of the Delta and other variants means that breakthrough infections and reinfections—which the researchers didn’t account for in their model—have become a much bigger concern.
Looking ahead to the end of 2021, Americans must continue to do everything they can to protect their communities from the spread of this terrible virus. That means getting vaccinated if you haven’t already, staying home and getting tested if you’ve got symptoms or know of an exposure, and taking other measures to keep yourself and your loved ones safe and well. These measures we take now will influence the infection rates and susceptibility to SARS-CoV-2 in our communities going forward. That will determine what the map of SARS-CoV-2 infections will look like in 2021 and beyond and, ultimately, how soon we can finally put this pandemic behind us.
Reference:
[1] Burden and characteristics of COVID-19 in the United States during 2020. Pei S, Yamana TK, Kandula S, Galanti M, Shaman J. Nature. 2021 Aug 26.
Links:
COVID-19 Research (NIH)
Sen Pei (Columbia University, New York)
Jeffrey Shaman (Columbia University, New York)
Genes, Blood Type Tied to Risk of Severe COVID-19
Posted on by Dr. Francis Collins
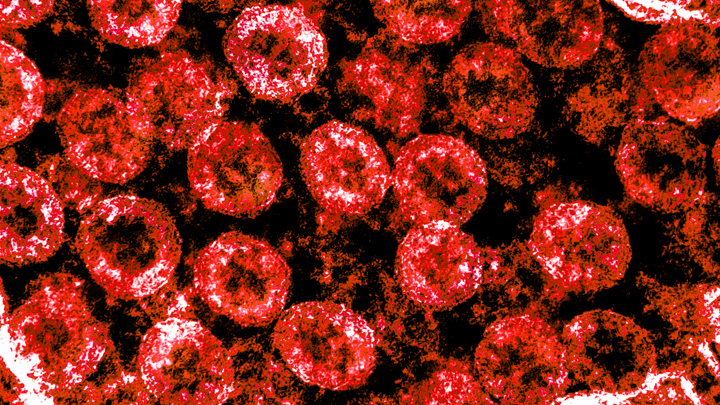
Credit: National Institute of Allergy and Infectious Diseases, NIH
Many people who contract COVID-19 have only a mild illness, or sometimes no symptoms at all. But others develop respiratory failure that requires oxygen support or even a ventilator to help them recover [1]. It’s clear that this happens more often in men than in women, as well as in people who are older or who have chronic health conditions. But why does respiratory failure also sometimes occur in people who are young and seemingly healthy?
A new study suggests that part of the answer to this question may be found in the genes that each one of us carries [2]. While more research is needed to pinpoint the precise underlying genes and mechanisms responsible, a recent genome-wide association (GWAS) study, just published in the New England Journal of Medicine, finds that gene variants in two regions of the human genome are associated with severe COVID-19 and correspondingly carry a greater risk of COVID-19-related death.
The two stretches of DNA implicated as harboring risks for severe COVID-19 are known to carry some intriguing genes, including one that determines blood type and others that play various roles in the immune system. In fact, the findings suggest that people with blood type A face a 50 percent greater risk of needing oxygen support or a ventilator should they become infected with the novel coronavirus. In contrast, people with blood type O appear to have about a 50 percent reduced risk of severe COVID-19.
These new findings—the first to identify statistically significant susceptibility genes for the severity of COVID-19—come from a large research effort led by Andre Franke, a scientist at Christian-Albrecht-University, Kiel, Germany, along with Tom Karlsen, Oslo University Hospital Rikshospitalet, Norway. Their study included 1,980 people undergoing treatment for severe COVID-19 and respiratory failure at seven medical centers in Italy and Spain.
In search of gene variants that might play a role in the severe illness, the team analyzed patient genome data for more than 8.5 million so-called single-nucleotide polymorphisms, or SNPs. The vast majority of these single “letter” nucleotide substitutions found all across the genome are of no health significance, but they can help to pinpoint the locations of gene variants that turn up more often in association with particular traits or conditions—in this case, COVID-19-related respiratory failure. To find them, the researchers compared SNPs in people with severe COVID-19 to those in more than 1,200 healthy blood donors from the same population groups.
The analysis identified two places that turned up significantly more often in the individuals with severe COVID-19 than in the healthy folks. One of them is found on chromosome 3 and covers a cluster of six genes with potentially relevant functions. For instance, this portion of the genome encodes a transporter protein known to interact with angiotensin converting enzyme 2 (ACE2), the surface receptor that allows the novel coronavirus that causes COVID-19, SARS-CoV-2, to bind to and infect human cells. It also encodes a collection of chemokine receptors, which play a role in the immune response in the airways of our lungs.
The other association signal popped up on chromosome 9, right over the area of the genome that determines blood type. Whether you are classified as an A, B, AB, or O blood type, depends on how your genes instruct your blood cells to produce (or not produce) a certain set of proteins. The researchers did find evidence suggesting a relationship between blood type and COVID-19 risk. They noted that this area also includes a genetic variant associated with increased levels of interleukin-6, which plays a role in inflammation and may have implications for COVID-19 as well.
These findings, completed in two months under very difficult clinical conditions, clearly warrant further study to understand the implications more fully. Indeed, Franke, Karlsen, and many of their colleagues are part of the COVID-19 Host Genetics Initiative, an ongoing international collaborative effort to learn the genetic determinants of COVID-19 susceptibility, severity, and outcomes. Some NIH research groups are taking part in the initiative, and they recently launched a study to look for informative gene variants in 5,000 COVID-19 patients in the United States and Canada.
The hope is that these and other findings yet to come will point the way to a more thorough understanding of the biology of COVID-19. They also suggest that a genetic test and a person’s blood type might provide useful tools for identifying those who may be at greater risk of serious illness.
References:
[1] Characteristics of and important lessons from the Coronavirus Disease 2019 (COVID-19) outbreak in China: Summary of a report of 72 314 cases from the Chinese Center for Disease Control and Prevention. Wu Z, McGoogan JM, et. al. 2020 Feb 24. [published online ahead of print]
[2] Genomewide association study of severe Covid-19 with respiratory failure. Ellinghaus D, Degenhardt F, et. a. NEJM. June 17, 2020.
Links:
The COVID-19 Host Genetics Initiative
Andre Franke (Christian-Albrechts-University of Kiel, Germany)
Tom Karlsen (Oslo University Hospital Rikshospitalet, Norway)
One Nation in Support of Biomedical Research?
Posted on by Dr. Sally Rockey and Dr. Francis Collins
 “It was the best of times, it was the worst of times.” Until recently, we’d never have dreamed of mentioning the famous opening line of Charles Dickens’ Tale of Two Cities in the context of U.S. biomedical research. But now those words ring all too true.
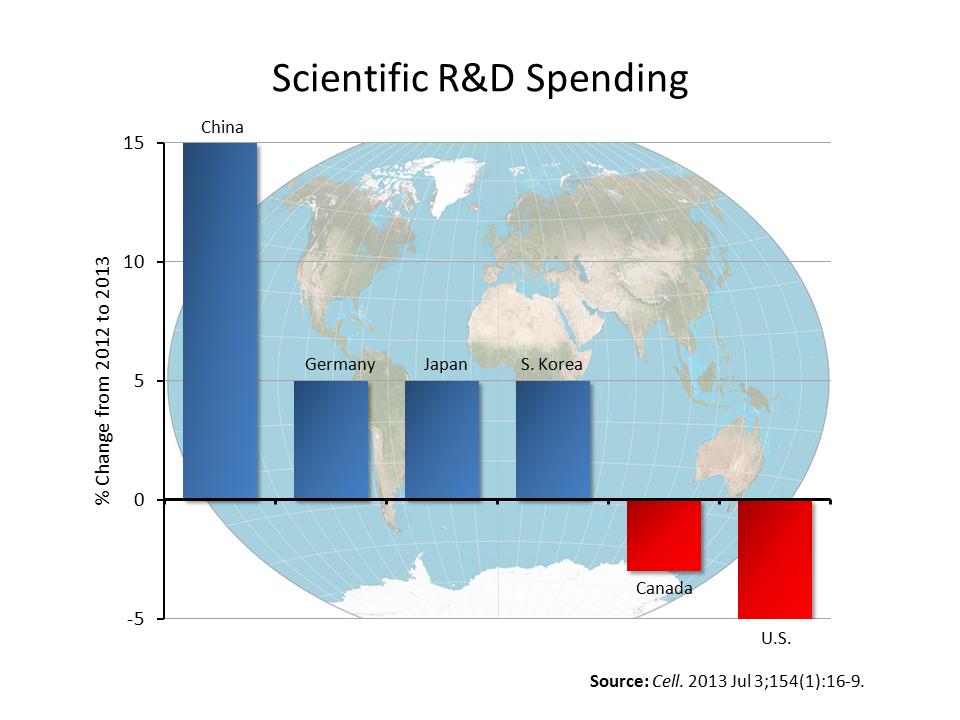
The “best of times” reflects the amazing technological advances and unprecedented scientific opportunities that exist right now. We’ve never had a better chance to make rapid progress in preventing, diagnosing, and curing human disease. But the “worst of times” is the other reality: NIH’s ability to support vital research at more than 2,500 universities and organizations across the nation is reeling from a decline in funding that threatens our health, our economy, and our standing as the world leader in biomedical innovation.
Smoking: It’s Killing Us
Posted on by Dr. Francis Collins
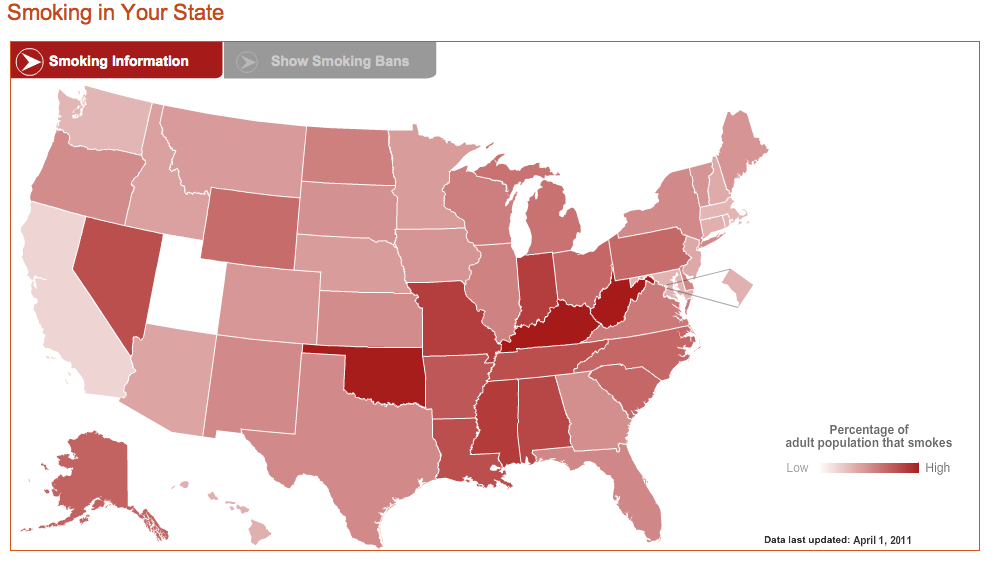
Smoking harms just about every body part—from heart and lungs to bladder and blood vessels. What’s new is that smoking is more of a health hazard than we thought. Two new, NIH-funded reports make the persuasive, and alarming, case—on average, smoking takes an entire decade off of your life! But smokers take note: there are tremendous benefits from quitting, regardless of your age.
A View of the U.S. Obesity Epidemic
Posted on by Dr. Francis Collins
 in U.S. Adults in 1985")
 in U.S. Adults in 1995")
 in U.S. Adults in 2005")
 in U.S. Adults in 2010")
These snapshots reveal a very disturbing trend: the rise in obesity in the US from 1985 to 2010. Today one third of adults in the US are obese, another third are overweight.
Because obesity has risen to epidemic levels—causing devastating and costly health problems, reducing life expectancy, and provoking stigma and discrimination—the NIH has established the NIH Obesity Research Task Force to accelerate progress in obesity research. For example, why are some individuals more susceptible to obesity? Can knowledge of biology and behavior be leveraged to develop better intervention strategies? What strategies work? For whom? Can these approaches be scaled up?