axons
The Amazing Brain: Toward a Wiring Diagram of Connectivity
Posted on by Dr. Francis Collins
It’s summertime and, thanks to the gift of COVID-19 vaccines, many folks are getting the chance to take a break. So, I think it’s also time that my blog readers finally get a break from what’s been nearly 18 months of non-stop coverage of COVID-19 research. And I can’t think of a more enjoyable way to do that than by taking a look at just a few of the many spectacular images and insights that researchers have derived about the amazing brain.
The Brain Research through Advancing Innovative Neurotechnologies® (BRAIN) Initiative, which is an NIH-led project aimed at revolutionizing our understanding of the human brain, happens to have generated some of the coolest—and most informative—imagery now available in neuroscience. So, throughout the month of August, I’ll share some of the entries from the initiative’s latest Show Us Your BRAINs! Photo and Video Contest.
With nearly 100 billion neurons and 100 trillion connections, the human brain remains one of the greatest mysteries in science. Among the many ways in which neuroscientists are using imaging to solve these mysteries is by developing more detailed maps of connectivity within the brain.
For example, the image featured above from the contest shows a dense weave of neurons in the anterior cingulate cortex, which is the part of the brain involved in learning, memory, and some motor control. In this fluorescence micrograph of tissue from a mouse, each neuron has been labeled with green fluorescent protein, enabling you to see how it connects to other neurons through arm-like projections called axons and dendrites.
The various connections, or circuits, within the brain process and relay distinct types of sensory information. In fact, a single neuron can form a thousand or more of these connections. Among the biggest challenges in biomedicine today is deciphering how these circuits work, and how they can misfire to cause potentially debilitating neurological conditions, including Alzheimer’s disease, Parkinson’s disease, autism, epilepsy, schizophrenia, depression, and traumatic brain injury.
This image was produced by Nicholas Foster and Lei Gao in the NIH-supported lab of Hong Wei Dong, University of California, Los Angeles. The Dong Lab is busy cataloging cell types and helping to assemble a wiring diagram of the connectivity in the mammalian brain—just one of the BRAIN Initiative’s many audacious goals. Stay tuned for more throughout the month of August!
Links:
Brain Research through Advancing Innovative Neurotechnologies® (BRAIN) Initiative (NIH)
Dong Lab (University of California, Los Angeles)
Show Us Your BRAINs! Photo and Video Contest (BRAIN Initiative/NIH)
NIH Support: National Institute of Mental Health
Defining Neurons in Technicolor
Posted on by Dr. Francis Collins

Can you identify a familiar pattern in this image’s square grid? Yes, it’s the outline of the periodic table! But instead of organizing chemical elements, this periodic table sorts 46 different types of neurons present in the visual cortex of a mouse brain.
Scientists, led by Hongkui Zeng at the Allen Institute for Brain Science, Seattle, constructed this periodic table by assigning colors to their neuronal discoveries based upon their main cell functions [1]. Cells in pinks, violets, reds, and oranges have inhibitory electrical activity, while those in greens and blues have excitatory electrical activity.
For any given cell, the darker colors indicate dendrites, which receive signals from other neurons. The lighter colors indicate axons, which transmit signals. Examples of electrical properties—the number and intensity of their “spikes”—appear along the edges of the table near the bottom.
To create this visually arresting image, Zeng’s NIH-supported team injected dye-containing probes into neurons. The probes are engineered to carry genes that make certain types of neurons glow bright colors under the microscope.
This allowed the researchers to examine a tiny slice of brain tissue and view each colored neuron’s shape, as well as measure its electrical response. They followed up with computational tools to combine these two characteristics and classify cell types based on their shape and electrical activity. Zeng’s team could then sort the cells into clusters using a computer algorithm to avoid potential human bias from visually interpreting the data.
Why compile such a detailed atlas of neuronal subtypes? Although scientists have been surveying cells since the invention of the microscope centuries ago, there is still no consensus on what a “cell type” is. Large, rich datasets like this atlas contain massive amounts of information to characterize individual cells well beyond their appearance under a microscope, helping to explain factors that make cells similar or dissimilar. Those differences may not be apparent to the naked eye.
Just last year, Allen Institute researchers conducted similar work by categorizing nearly 24,000 cells from the brain’s visual and motor cortex into different types based upon their gene activity [2]. The latest research lines up well with the cell subclasses and types categorized in the previous gene-activity work. As a result, the scientists have more evidence that each of the 46 cell types is actually distinct from the others and likely drives a particular function within the visual cortex.
Publicly available resources, like this database of cell types, fuel much more discovery. Scientists all over the world can look at this table (and soon, more atlases from other parts of the brain) to see where a cell type fits into a region of interest and how it might behave in a range of brain conditions.
References:
[1] Classification of electrophysiological and morphological neuron types in the mouse visual cortex. N Gouwens NW, et al. Neurosci. 2019 Jul;22(7):1182-1195.
[2] Shared and distinct transcriptomic cell types across neocortical areas. Tasic B, et al. Nature. 2018 Nov;563(7729):72-78.
Links:
Brain Basics: The Life and Death of a Neuron (National Institute of Neurological Disorders and Stroke/NIH)
Cell Types: Overview of the Data (Allen Brain Atlas/Allen Institute for Brain Science, Seattle)
Hongkui Zeng (Allen Institute)
NIH Support: National Institute of Mental Health; Eunice Kennedy Shriver National Institute of Child Health & Human Development
Snapshots of Life: Healing Spinal Cord Injuries
Posted on by Dr. Francis Collins

Credit: Mark McClendon, Zaida Alvarez Pinto, Samuel I. Stupp, Northwestern University, Evanston, IL
When someone suffers a fully severed spinal cord, it’s considered highly unlikely the injury will heal on its own. That’s because the spinal cord’s neural tissue is notorious for its inability to bridge large gaps and reconnect in ways that restore vital functions. But the image above is a hopeful sight that one day that could change.
Here, a mouse neural stem cell (blue and green) sits in a lab dish, atop a special gel containing a mat of synthetic nanofibers (purple). The cell is growing and sending out spindly appendages, called axons (green), in an attempt to re-establish connections with other nearby nerve cells.
Snapshots of Life: Hardwired to Sense Food Texture
Posted on by Dr. Francis Collins

Credit: Zhang, Y.V., Aikin, T.J., Li, Z., and Montell, C., University of California, Santa Barbara
It’s a problem that parents know all too well: a child won’t eat because their oatmeal is too slimy or a slice of apple is too hard. Is the kid just being finicky? Or is there a biological basis for disliking food based on its texture? This image, showing the tongue (red) of a fruit fly (Drosophila melanogaster), provides some of the first evidence that biology could indeed play a role [1].
The image shows a newly discovered mechanosensory nerve cell (green), which is called md-L, short for multidendritic neuron in the labellum. When the fly extends its tongue to eat, the hair bristles (short red lines) on its surface bend in proportion to the consistency of the food. If a bristle is bent hard enough, the force is detected at its base by one of the arms of an md-L neuron. In response, the arm shoots off an electrical signal that’s relayed to the central part of the neuron and onward to the brain via the outgoing informational arm, or axon.
Cool Videos: Reconstructing the Cerebral Cortex
Posted on by Dr. Francis Collins
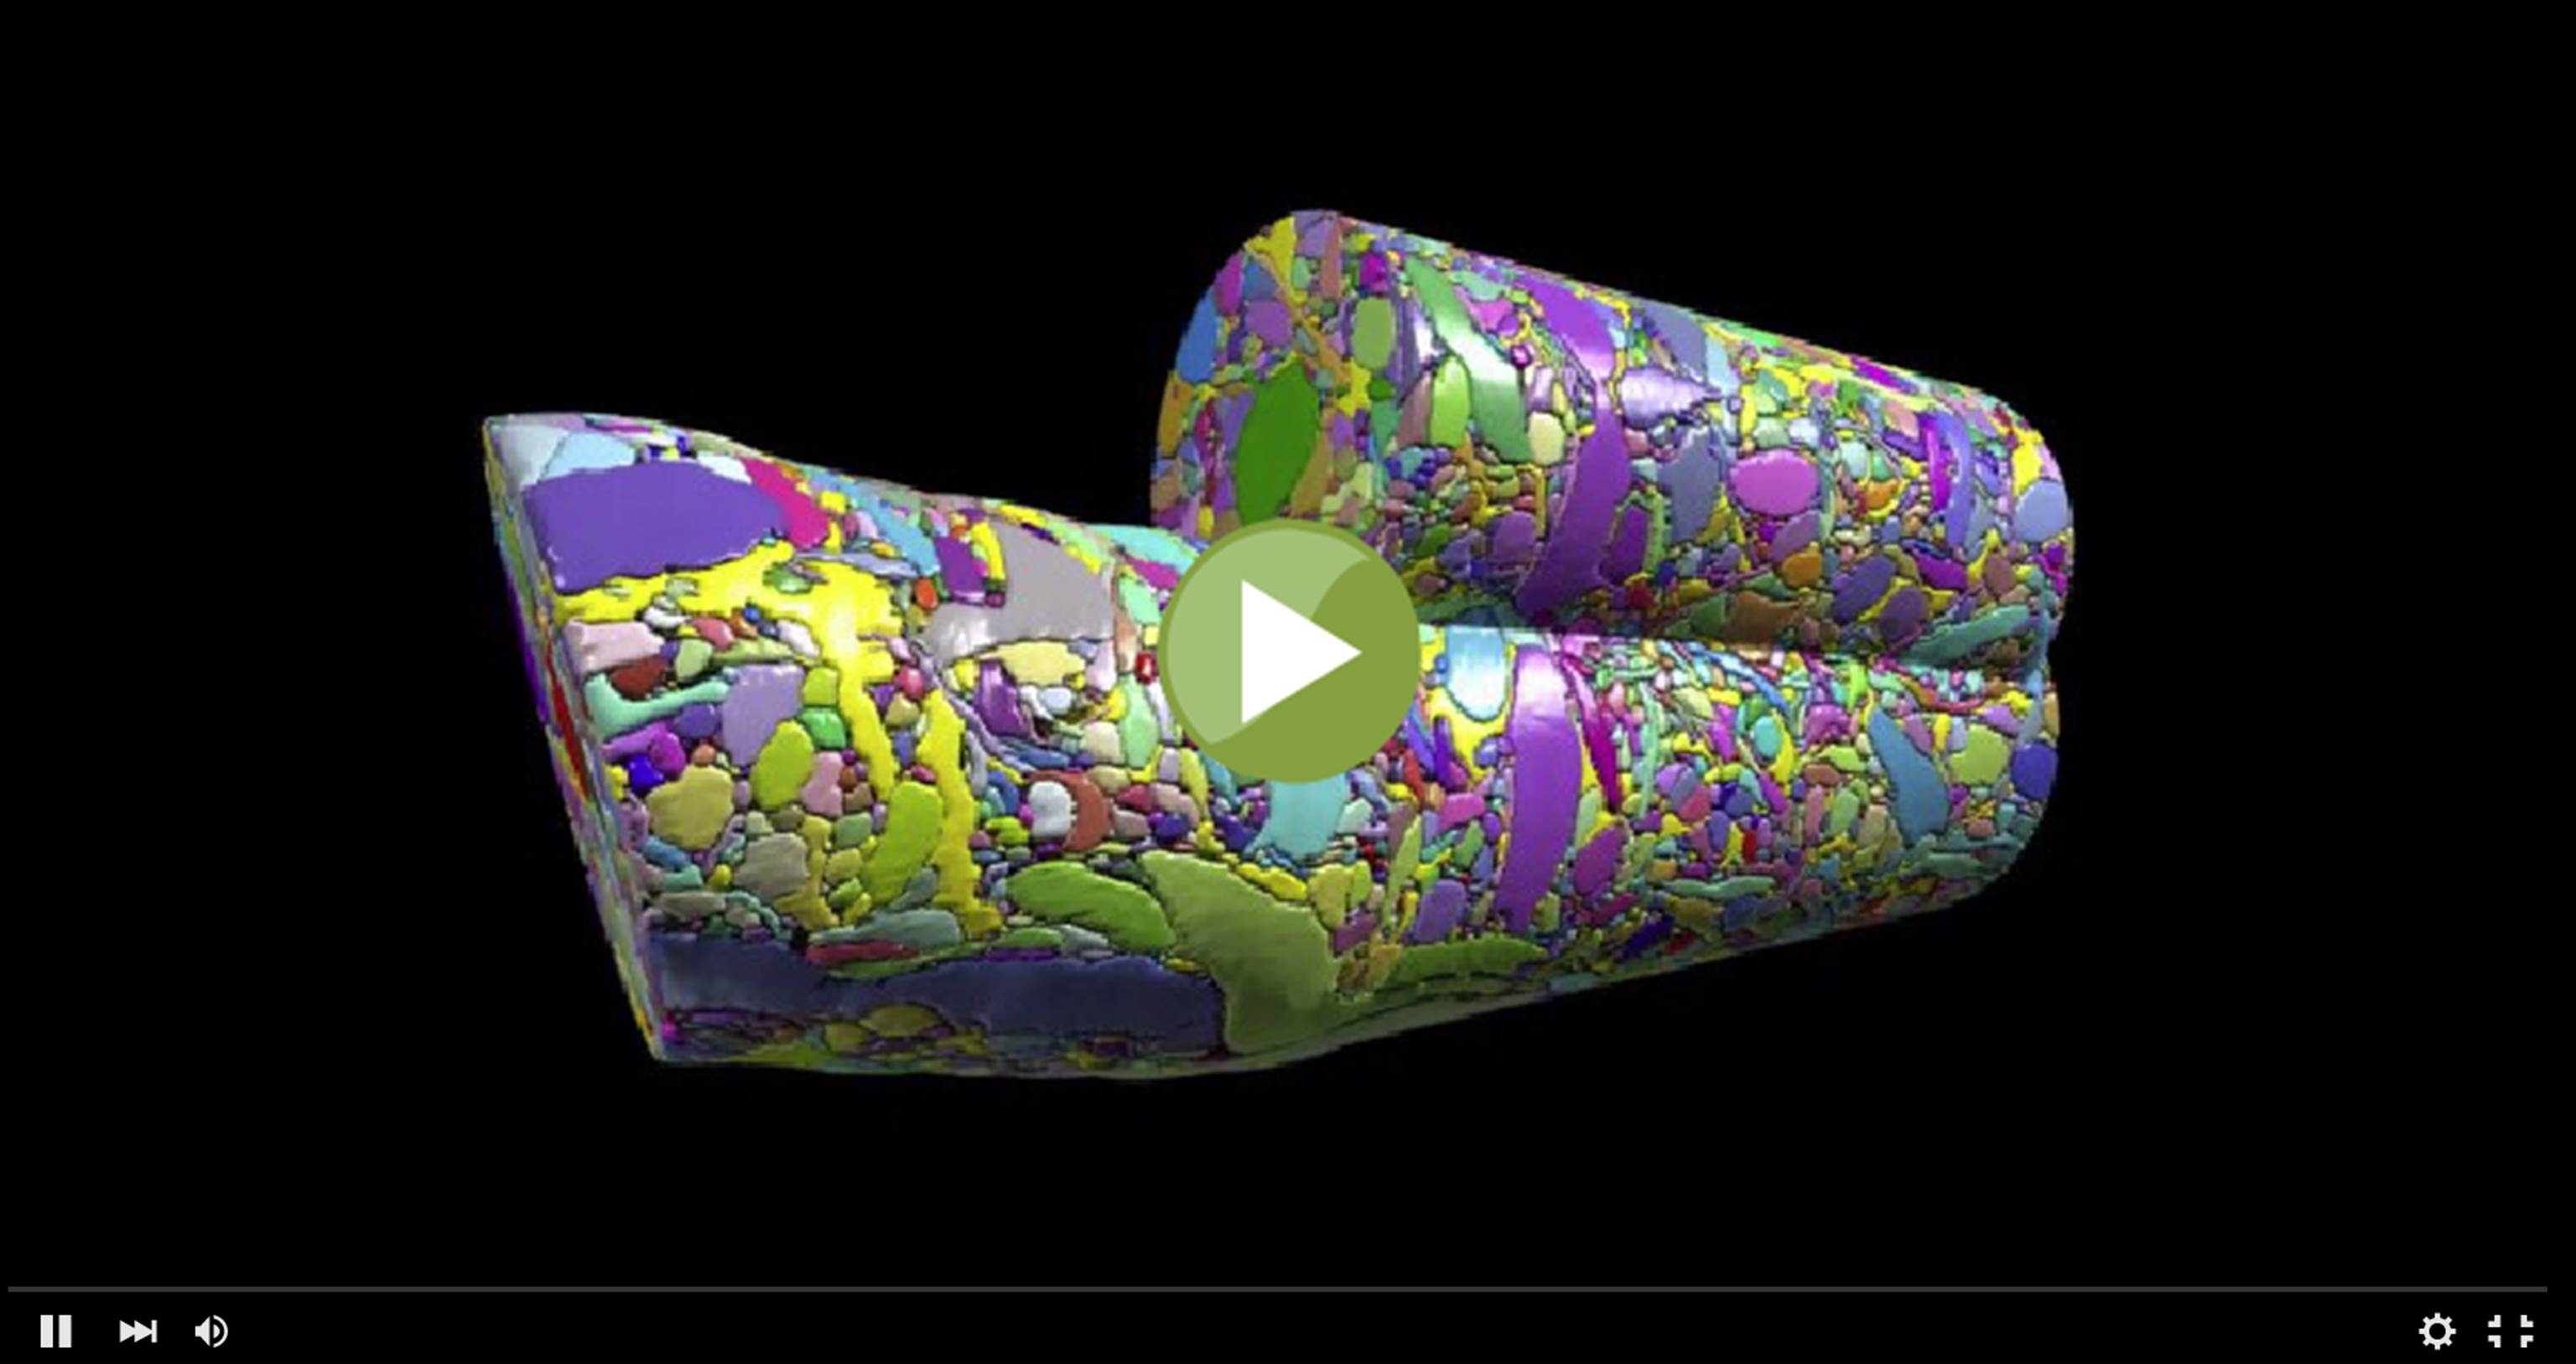
This colorful cylinder could pass for some sort of modern art sculpture, but it actually represents a sneak peak at some of the remarkable science that we can look forward to seeing from the Brain Research through Advancing Innovative Neurotechnologies (BRAIN) Initiative. In a recent study in the journal Cell [1], NIH grantee Jeff Lichtman of Harvard University, Cambridge, MA and his colleagues unveiled the first digitized reconstruction of tissue from the mammalian cerebral cortex—the outermost part of the brain, responsible for complex behaviors.
Specifically, Lichtman’s group mapped in exquisite detail a very small cube of a mouse’s cerebral cortex. In fact, the cube is so tiny (smaller than a grain of sand!) that it contained no whole cells, just a profoundly complex tangle of finger-like nerve cell extensions called axons and dendrites. And what you see in this video is just one cylindrical portion of that tissue sample, in which Licthtman and colleagues went full force to identify and label every single cellular and intracellular element. The message-sending axons are delineated in an array of pastel colors, while more vivid hues of red, green, and purple mark the message-receiving dendrites and bright yellow indicates the nerve-insulating glia. In total, the cylinder contains parts of about 600 axons, 40 different dendrites, and 500 synapses, where nerve impulses are transmitted between cells.