visual cortex
The Amazing Brain: Capturing Neurons in Action
Posted on by Lawrence Tabak, D.D.S., Ph.D.
With today’s powerful imaging tools, neuroscientists can monitor the firing and function of many distinct neurons in our brains, even while we move freely about. They also possess another set of tools to capture remarkable, high-resolution images of the brain’s many thousands of individual neurons, tracing the form of each intricate branch of their tree-like structures.
Most brain imaging approaches don’t capture neural form and function at once. Yet that’s precisely what you’re seeing in this knockout of a movie, another winner in the Show Us Your BRAINs! Photo and Video Contest, supported by NIH’s Brain Research through Advancing Innovative Neurotechnologies® (BRAIN) Initiative.
This first-of-its kind look into the mammalian brain produced by Andreas Tolias, Baylor College of Medicine, Houston, and colleagues features about 200 neurons in the visual cortex, which receives and processes visual information. First, you see a colorful, tightly packed network of neurons. Then, those neurons, which were colorized by the researchers in vibrant pinks, reds, blues, and greens, pull apart to reveal their finely detailed patterns and shapes. Throughout the video, you can see neural activity, which appears as flashes of white that resemble lightning bolts.
Making this movie was a multi-step process. First, the Tolias group presented laboratory mice with a series of visual cues, using a functional imaging approach called two-photon calcium imaging to record the electrical activity of individual neurons. While this technique allowed the researchers to pinpoint the precise locations and activity of each individual neuron in the visual cortex, they couldn’t zoom in to see their precise structures.
So, the Baylor team sent the mice to colleagues Nuno da Costa and Clay Reid, Allen Institute for Brain Science, Seattle, who had the needed electron microscopes and technical expertise to zoom in on these structures. Their data allowed collaborator Sebastian Seung’s team, Princeton University, Princeton, NJ, to trace individual neurons in the visual cortex along their circuitous paths. Finally, they used sophisticated machine learning algorithms to carefully align the two imaging datasets and produce this amazing movie.
This research was supported by Intelligence Advanced Research Projects Activity (IARPA), part of the Office of the Director of National Intelligence. The IARPA is one of NIH’s governmental collaborators in the BRAIN Initiative.
Tolias and team already are making use of their imaging data to learn more about the precise ways in which individual neurons and groups of neurons in the mouse visual cortex integrate visual inputs to produce a coherent view of the animals’ surroundings. They’ve also collected an even-larger data set, scaling their approach up to tens of thousands of neurons. Those data are now freely available to other neuroscientists to help advance their work. As researchers make use of these and similar data, this union of neural form and function will surely yield new high-resolution discoveries about the mammalian brain.
Links:
Tolias Lab (Baylor College of Medicine, Houston)
Nuno da Costa (Allen Institute for Brain Science, Seattle)
R. Clay Reid (Allen Institute)
H. Sebastian Seung (Princeton University, Princeton, NJ)
Machine Intelligence from Cortical Networks (MICrONS) Explorer
Brain Research through Advancing Innovative Neurotechnologies® (BRAIN) Initiative (NIH)
Show Us Your BRAINs Photo & Video Contest (BRAIN Initiative)
NIH Support: BRAIN Initiative; Common Fund
Human Brain Compresses Working Memories into Low-Res ‘Summaries’
Posted on by Lawrence Tabak, D.D.S., Ph.D.
You have probably done it already a few times today. Paused to remember a password, a shopping list, a phone number, or maybe the score to last night’s ballgame. The ability to store and recall needed information, called working memory, is essential for most of the human brain’s higher cognitive processes.
Researchers are still just beginning to piece together how working memory functions. But recently, NIH-funded researchers added an intriguing new piece to this neurobiological puzzle: how visual working memories are “formatted” and stored in the brain.
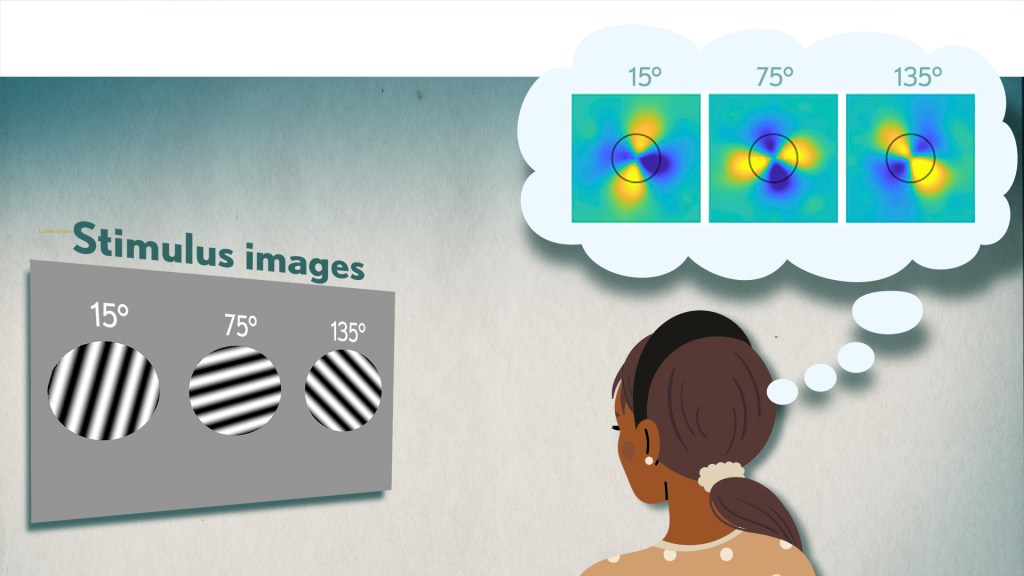
The findings, published in the journal Neuron, show that the visual cortex—the brain’s primary region for receiving, integrating, and processing visual information from the eye’s retina—acts more like a blackboard than a camera. That is, the visual cortex doesn’t photograph all the complex details of a visual image, such as the color of paper on which your password is written or the precise series of lines that make up the letters. Instead, it recodes visual information into something more like simple chalkboard sketches.
The discovery suggests that those pared down, low-res representations serve as a kind of abstract summary, capturing the relevant information while discarding features that aren’t relevant to the task at hand. It also shows that different visual inputs, such as spatial orientation and motion, may be stored in virtually identical, shared memory formats.
The new study, from Clayton Curtis and Yuna Kwak, New York University, New York, builds upon a known fundamental aspect of working memory. Many years ago, it was determined that the human brain tends to recode visual information. For instance, if passed a 10-digit phone number on a card, the visual information gets recoded and stored in the brain as the sounds of the numbers being read aloud.
Curtis and Kwak wanted to learn more about how the brain formats representations of working memory in patterns of brain activity. To find out, they measured brain activity with functional magnetic resonance imaging (fMRI) while participants used their visual working memory.
In each test, study participants were asked to remember a visual stimulus presented to them for 12 seconds and then make a memory-based judgment on what they’d just seen. In some trials, as shown in the image above, participants were shown a tilted grating, a series of black and white lines oriented at a particular angle. In others, they observed a cloud of dots, all moving in a direction to represent those same angles. After a short break, participants were asked to recall and precisely indicate the angle of the grating’s tilt or the dot cloud’s motion as accurately as possible.
It turned out that either visual stimulus—the grating or moving dots—resulted in the same patterns of neural activity in the visual cortex and parietal cortex. The parietal cortex is a part of the brain used in memory processing and storage.
These two distinct visual memories carrying the same relevant information seemed to have been recoded into a shared abstract memory format. As a result, the pattern of brain activity trained to recall motion direction was indistinguishable from that trained to recall the grating orientation.
This result indicated that only the task-relevant features of the visual stimuli had been extracted and recoded into a shared memory format. But Curtis and Kwak wondered whether there might be more to this finding.
To take a closer look, they used a sophisticated model that allowed them to project the three-dimensional patterns of brain activity into a more-informative, two-dimensional representation of visual space. And, indeed, their analysis of the data revealed a line-like pattern, similar to a chalkboard sketch that’s oriented at the relevant angles.
The findings suggest that participants weren’t actually remembering the grating or a complex cloud of moving dots at all. Instead, they’d compressed the images into a line representing the angle that they’d been asked to remember.
Many questions remain about how remembering a simple angle, a relatively straightforward memory formation, will translate to the more-complex sets of information stored in our working memory. On a technical level, though, the findings show that working memory can now be accessed and captured in ways that hadn’t been possible before. This will help to delineate the commonalities in working memory formation and the possible differences, whether it’s remembering a password, a shopping list, or the score of your team’s big victory last night.
Reference:
[1] Unveiling the abstract format of mnemonic representations. Kwak Y, Curtis CE. Neuron. 2022, April 7; 110(1-7).
Links:
Working Memory (National Institute of Mental Health/NIH)
The Curtis Lab (New York University, New York)
NIH Support: National Eye Institute
Finding Better Ways to Image the Retina
Posted on by Dr. Francis Collins
Every day, all around the world, eye care professionals are busy performing dilated eye exams. By looking through a patient’s widened pupil, they can view the retina—the postage stamp-sized tissue lining the back of the inner eye—and look for irregularities that may signal the development of vision loss.
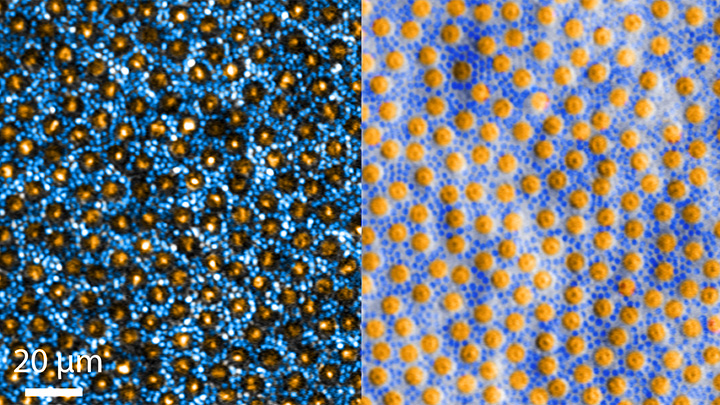
The great news is that, thanks to research, retinal imaging just keeps getting better and better. The images above, which show the same cells viewed with two different microscopic techniques, provide good examples of how tweaking existing approaches can significantly improve our ability to visualize the retina’s two types of light-sensitive neurons: rod and cone cells.
Specifically, these images show an area of the outer retina, which is the part of the tissue that’s observed during a dilated eye exam. Thanks to colorization and other techniques, a viewer can readily distinguish between the light-sensing, color-detecting cone cells (orange) and the much smaller, lowlight-sensing rod cells (blue).
These high-res images come from Johnny Tam, a researcher with NIH’s National Eye Institute. Working with Alfredo Dubra, Stanford University, Palo Alto, CA, Tam and his team figured out how to limit light distortion of the rod cells. The key was illuminating the eye using less light, provided as a halo instead of the usual solid, circular beam.
But the researchers’ solution hit a temporary snag when the halo reflected from the rods and cones created another undesirable ring of light. To block it out, Tam’s team introduced a tiny pinhole, called a sub-Airy disk. Along with use of adaptive optics technology [1] to correct for other distortions of light, the scientists were excited to see such a clear view of individual rods and cones. They published their findings recently in the journal Optica [2]
The resolution produced using these techniques is so much improved (33 percent better than with current methods) that it’s even possible to visualize the tiny inner segments of both rods and cones. In the cones, for example, these inner segments help direct light coming into the eye to other, photosensitive parts that absorb single photons of light. The light is then converted into electrical signals that stream to the brain’s visual centers in the occipital cortex, which makes it possible for us to experience vision.
Tam and team are currently working with physician-scientists in the NIH Clinical Center to image the retinas of people with a variety of retinal diseases, including age-related macular degeneration (AMD), a leading cause of vision loss in older adults. These research studies are ongoing, but offer hopeful possibilities for safe and non-intrusive monitoring of individual rods and cones over time, as well as across disease types. That’s obviously good news for patients. Plus it will help scientists understand how a rod or cone cell stops working, as well as more precisely test the effects of gene therapy and other experimental treatments aimed at restoring vision.
References:
[1] Noninvasive imaging of the human rod photoreceptor mosaic using a confocal adaptive optics scanning ophthalmoscope. Dubra A, Sulai Y, Norris JL, Cooper RF, Dubis AM, Williams DR, Carroll J. Biomed Opt Express. 2011 Jul 1;2(7):1864-76.
[1] In-vivo sub-diffraction adaptive optics imaging of photoreceptors in the human eye with annular pupil illumination and sub-Airy detection. Rongwen L, Aguilera N, Liu T, Liu J, Giannini JP, Li J, Bower AJ, Dubra A, Tam J. Optica 2021 8, 333-343. https://doi.org/10.1364/OPTICA.414206
Links:
Get a Dilated Eye Exam (National Eye Institute/NIH)
How the Eyes Work (NEI)
Eye Health Data and Statistics (NEI)
Tam Lab (NEI)
Dubra Lab (Stanford University, Palo Alto, CA)
NIH Support: National Eye Institute
Defining Neurons in Technicolor
Posted on by Dr. Francis Collins

Can you identify a familiar pattern in this image’s square grid? Yes, it’s the outline of the periodic table! But instead of organizing chemical elements, this periodic table sorts 46 different types of neurons present in the visual cortex of a mouse brain.
Scientists, led by Hongkui Zeng at the Allen Institute for Brain Science, Seattle, constructed this periodic table by assigning colors to their neuronal discoveries based upon their main cell functions [1]. Cells in pinks, violets, reds, and oranges have inhibitory electrical activity, while those in greens and blues have excitatory electrical activity.
For any given cell, the darker colors indicate dendrites, which receive signals from other neurons. The lighter colors indicate axons, which transmit signals. Examples of electrical properties—the number and intensity of their “spikes”—appear along the edges of the table near the bottom.
To create this visually arresting image, Zeng’s NIH-supported team injected dye-containing probes into neurons. The probes are engineered to carry genes that make certain types of neurons glow bright colors under the microscope.
This allowed the researchers to examine a tiny slice of brain tissue and view each colored neuron’s shape, as well as measure its electrical response. They followed up with computational tools to combine these two characteristics and classify cell types based on their shape and electrical activity. Zeng’s team could then sort the cells into clusters using a computer algorithm to avoid potential human bias from visually interpreting the data.
Why compile such a detailed atlas of neuronal subtypes? Although scientists have been surveying cells since the invention of the microscope centuries ago, there is still no consensus on what a “cell type” is. Large, rich datasets like this atlas contain massive amounts of information to characterize individual cells well beyond their appearance under a microscope, helping to explain factors that make cells similar or dissimilar. Those differences may not be apparent to the naked eye.
Just last year, Allen Institute researchers conducted similar work by categorizing nearly 24,000 cells from the brain’s visual and motor cortex into different types based upon their gene activity [2]. The latest research lines up well with the cell subclasses and types categorized in the previous gene-activity work. As a result, the scientists have more evidence that each of the 46 cell types is actually distinct from the others and likely drives a particular function within the visual cortex.
Publicly available resources, like this database of cell types, fuel much more discovery. Scientists all over the world can look at this table (and soon, more atlases from other parts of the brain) to see where a cell type fits into a region of interest and how it might behave in a range of brain conditions.
References:
[1] Classification of electrophysiological and morphological neuron types in the mouse visual cortex. N Gouwens NW, et al. Neurosci. 2019 Jul;22(7):1182-1195.
[2] Shared and distinct transcriptomic cell types across neocortical areas. Tasic B, et al. Nature. 2018 Nov;563(7729):72-78.
Links:
Brain Basics: The Life and Death of a Neuron (National Institute of Neurological Disorders and Stroke/NIH)
Cell Types: Overview of the Data (Allen Brain Atlas/Allen Institute for Brain Science, Seattle)
Hongkui Zeng (Allen Institute)
NIH Support: National Institute of Mental Health; Eunice Kennedy Shriver National Institute of Child Health & Human Development
Taking Brain Imaging Even Deeper
Posted on by Dr. Francis Collins
Thanks to yet another amazing advance made possible by the NIH-led Brain Research through Advancing Innovative Neurotechnologies® (BRAIN) Initiative, I can now take you on a 3D fly-through of all six layers of the part of the mammalian brain that processes external signals into vision. This unprecedented view is made possible by three-photon microscopy, a low-energy imaging approach that is allowing researchers to peer deeply within the brains of living creatures without damaging or killing their brain cells.
The basic idea of multi-photon microscopy is this: for fluorescence microscopy to work, you want to deliver a specific energy level of photons (usually with a laser) to excite a fluorescent molecule, so that it will emit light at a slightly lower energy (longer wavelength) and be visualized as a burst of colored light in the microscope. That’s how fluorescence works. Green fluorescent protein (GFP) is one of many proteins that can be engineered into cells or mice to make that possible.
But for that version of the approach to work on tissue, the excited photons need to penetrate deeply, and that’s not possible for such high energy photons. So two-photon strategies were developed, where it takes the sum of the energy of two simultaneous photons to hit the target in order to activate the fluorophore.
That approach has made a big difference, but for deep tissue penetration the photons are still too high in energy. Enter the three-photon version! Now the even lower energy of the photons makes tissue more optically transparent, though for activation of the fluorescent protein, three photons have to hit it simultaneously. But that’s part of the beauty of the system—the visual “noise” also goes down.
This particular video shows what takes place in the visual cortex of mice when objects pass before their eyes. As the objects appear, specific neurons (green) are activated to process the incoming information. Nearby, and slightly obscuring the view, are the blood vessels (pink, violet) that nourish the brain. At 33 seconds into the video, you can see the neurons’ myelin sheaths (pink) branching into the white matter of the brain’s subplate, which plays a key role in organizing the visual cortex during development.
This video comes from a recent paper in Nature Communications by a team from Massachusetts Institute of Technology, Cambridge [1]. To obtain this pioneering view of the brain, Mriganka Sur, Murat Yildirim, and their colleagues built an innovative microscope that emits three low-energy photons. After carefully optimizing the system, they were able to peer more than 1,000 microns (0.05 inches) deep into the visual cortex of a live, alert mouse, far surpassing the imaging capacity of standard one-photon microscopy (100 microns) and two-photon microscopy (400-500 microns).
This improved imaging depth allowed the team to plumb all six layers of the visual cortex (two-photon microscopy tops out at about three layers), as well as to record in real time the brain’s visual processing activities. Helping the researchers to achieve this feat was the availability of a genetically engineered mouse model in which the cells of the visual cortex are color labelled to distinguish blood vessels from neurons, and to show when neurons are active.
During their in-depth imaging experiments, the MIT researchers found that each of the visual cortex’s six layers exhibited different responses to incoming visual information. One of the team’s most fascinating discoveries is that neurons residing on the subplate are actually quite active in adult animals. It had been assumed that these subplate neurons were active only during development. Their role in mature animals is now an open question for further study.
Sur often likens the work in his neuroscience lab to astronomers and their perpetual quest to see further into the cosmos—but his goal is to see ever deeper into the brain. His group, along with many other researchers supported by the BRAIN Initiative, are indeed proving themselves to be biological explorers of the first order.
Reference:
[1] Functional imaging of visual cortical layers and subplate in awake mice with optimized three-photon microscopy. Yildirim M, Sugihara H, So PTC, Sur M. Nat Commun. 2019 Jan 11;10(1):177.
Links:
Sur Lab (Massachusetts Institute of Technology, Cambridge)
The Brain Research through Advancing Innovative Neurotechnologies® (BRAIN) Initiative (NIH)
NIH Support: National Eye Institute; National Institute of Neurological Disorders and Stroke; National Institute of Biomedical Imaging and Bioengineering
Vision Loss Boosts Auditory Perception
Posted on by Dr. Francis Collins

Credit: Emily Petrus, Johns Hopkins University, Baltimore
Many people with vision loss—including such gifted musicians as the late Doc Watson (my favorite guitar picker), Stevie Wonder, Andrea Bocelli, and the Blind Boys of Alabama—are thought to have supersensitive hearing. They are often much better at discriminating pitch, locating the origin of sounds, and hearing softer tones than people who can see. Now, a new animal study suggests that even a relatively brief period of simulated blindness may have the power to enhance hearing among those with normal vision.
In the study, NIH-funded researchers at the University of Maryland in College Park, and Johns Hopkins University in Baltimore, found that when they kept adult mice in complete darkness for one week, the animals’ ability to hear significantly improved [1]. What’s more, when they examined the animals’ brains, the researchers detected changes in the connections among neurons in the part of the brain where sound is processed, the auditory cortex.