brain scan
Brain in Motion
Posted on by Dr. Francis Collins
Credit: Itamar Terem, Stanford University, Palo Alto, CA, and Samantha Holdsworth, University of Auckland, New Zealand
Though our thoughts can wander one moment and race rapidly forward the next, the brain itself is often considered to be motionless inside the skull. But that’s actually not correct. When the heart beats, the pumping force reverberates throughout the body and gently pulsates the brain. What’s been tricky is capturing these pulsations with existing brain imaging technologies.
Recently, NIH-funded researchers developed a video-based approach to magnetic resonance imaging (MRI) that can record these subtle movements [1]. Their method, called phase-based amplified MRI (aMRI), magnifies those tiny movements, making them more visible and quantifiable. The latest aMRI method, developed by a team including Itamar Terem at Stanford University, Palo Alto, CA, and Mehmet Kurt at Stevens Institute of Technology, Hoboken, NJ. It builds upon an earlier method developed by Samantha Holdsworth at New Zealand’s University of Auckland and Stanford’s Mahdi Salmani Rahimi [2].
Big Data and Imaging Analysis Yields High-Res Brain Map
Posted on by Dr. Francis Collins

Caption: Map of 180 areas in the left and right hemispheres of the cerebral cortex.
Credit: Matthew F. Glasser, David C. Van Essen, Washington University Medical School, Saint Louis, Missouri
Neuroscientists have been working for a long time to figure out how the human brain works, and that has led many through the years to attempt to map its various regions and create a detailed atlas of their complex geography and functions. While great progress has been made in recent years, existing brain maps have remained relatively blurry and incomplete, reflecting only limited aspects of brain structure or function and typically in just a few people.
In a study reported recently in the journal Nature, an NIH-funded team of researchers has begun to bring this map of the human brain into much sharper focus [1]. By combining multiple types of cutting-edge brain imaging data from more than 200 healthy young men and women, the researchers were able to subdivide the cerebral cortex, the brain’s outer layer, into 180 specific areas in each hemisphere. Remarkably, almost 100 of those areas had never before been described. This new high-resolution brain map will advance fundamental understanding of the human brain and will help to bring greater precision to the diagnosis and treatment of many brain disorders.
Alzheimer’s Disease: Tau Protein Predicts Early Memory Loss
Posted on by Dr. Francis Collins
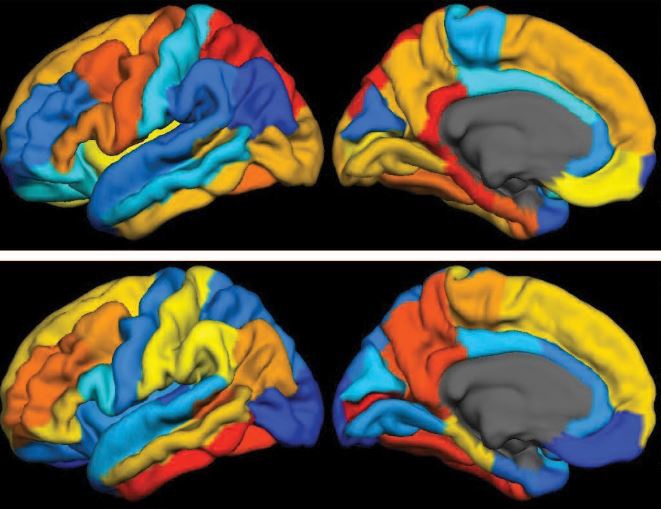
Caption: PET scan images show distribution of tau (top panel) and beta-amyloid (bottom panel) across a brain with early Alzheimer’s disease. Red indicates highest levels of protein binding, dark blue the lowest, yellows and oranges indicate moderate binding.
Credit: Brier et al., Sci Transl Med
In people with Alzheimer’s disease, changes in the brain begin many years before the first sign of memory problems. Those changes include the gradual accumulation of beta-amyloid peptides and tau proteins, which form plaques and tangles that are considered hallmarks of the disease. While amyloid plaques have received much attention as an early indicator of disease, until very recently there hadn’t been any way during life to measure the buildup of tau protein in the brain. As a result, much less is known about the timing and distribution of tau tangles and its relationship to memory loss.
Now, in a study published in Science Translational Medicine, an NIH-supported research team has produced some of the first maps showing where tau proteins build up in the brains of people with early Alzheimer’s disease [1]. The new findings suggest that while beta-amyloid remains a reliable early sign of Alzheimer’s disease, tau may be a more informative predictor of a person’s cognitive decline and potential response to treatment.
Personalizing Depression Treatment with Brain Scans
Posted on by Dr. Francis Collins

Caption: Depressed patients with higher activity in the anterior insula (where the green lines intersect) did better with medication than cognitive behavior therapy.
Source: Helen Mayberg, Emory University School of Medicine, Department of Psychiatry and Behavioral Sciences
Today, figuring out who will benefit from which antidepressant medication is hit or miss—physicians prescribe a medication to treat major depression for two to three months, and then gauge the results. This trial and error is frustrating and expensive; typically only about 40% get well after this first treatment or see an improvement in symptoms. The other 60% must try a different drug or some other approach. In a new NIH funded study, researchers showed how brain scans could predict which individuals would benefit from a medication and which might respond better to psychotherapy [1].