transcriptomics
Brain Atlas Paves the Way for New Understanding of How the Brain Functions
Posted on by Lawrence Tabak, D.D.S., Ph.D.

When NIH launched The BRAIN Initiative® a decade ago, one of many ambitious goals was to develop innovative technologies for profiling single cells to create an open-access reference atlas cataloguing the human brain’s many parts. The ultimate goal wasn’t to produce a single, static reference map, but rather to capture a dynamic view of how the brain’s many cells of varied types are wired to work together in the healthy brain and how this picture may shift in those with neurological and mental health disorders.
So I’m now thrilled to report the publication of an impressive collection of work from hundreds of scientists in the BRAIN Initiative Cell Census Network (BICCN), detailed in more than 20 papers in Science, Science Advances, and Science Translational Medicine.1 Among many revelations, this unprecedented, international effort has characterized more than 3,000 human brain cell types. To put this into some perspective, consider that the human lung contains 61 cell types.2 The work has also begun to uncover normal variation in the brains of individual people, some of the features that distinguish various disease states, and distinctions among key parts of the human brain and those of our closely related primate cousins.
Of course, it’s not possible to do justice to this remarkable body of work or its many implications in the space of a single blog post. But to give you an idea of what’s been accomplished, some of these studies detail the primary effort to produce a comprehensive brain atlas, including defining the brain’s many cell types along with their underlying gene activity and the chemical modifications that turn gene activity up or down.3,4,5
Other studies in this collection take a deep dive into more specific brain areas. For instance, to capture normal variations among people, a team including Nelson Johansen, University of California, Davis, profiled cells in the neocortex—the outermost portion of the brain that’s responsible for many complex human behaviors.6 Overall, the work revealed a highly consistent cellular makeup from one person to the next. But it also highlighted considerable variation in gene activity, some of which could be explained by differences in age, sex and health. However, much of the observed variation remains unexplained, opening the door to more investigations to understand the meaning behind such brain differences and their role in making each of us who we are.
Yang Li, now at Washington University in St. Louis, and his colleagues analyzed 1.1 million cells from 42 distinct brain areas in samples from three adults.4 They explored various cell types with potentially important roles in neuropsychiatric disorders and were able to pinpoint specific cell types, genes and genetic switches that may contribute to the development of certain traits and disorders, including bipolar disorder, depression and schizophrenia.
Yet another report by Nikolas Jorstad, Allen Institute, Seattle, and colleagues delves into essential questions about what makes us human as compared to other primates like chimpanzees.7 Their comparisons of gene activity at the single-cell level in a specific area of the brain show that humans and other primates have largely the same brain cell types, but genes are activated differently in specific cell types in humans as compared to other primates. Those differentially expressed genes in humans often were found in portions of the genome that show evidence of rapid change over evolutionary time, suggesting that they play important roles in human brain function in ways that have yet to be fully explained.
All the data represented in this work has been made publicly accessible online for further study. Meanwhile, the effort to build a more finely detailed picture of even more brain cell types and, with it, a more complete understanding of human brain circuitry and how it can go awry continues in the BRAIN Initiative Cell Atlas Network (BICAN). As impressive as this latest installment is—in our quest to understand the human brain, brain disorders, and their treatment—we have much to look forward to in the years ahead.
References:
A list of all the papers part of the brain atlas research is available here: https://www.science.org/collections/brain-cell-census.
[1] M Maroso. A quest into the human brain. Science DOI: 10.1126/science.adl0913 (2023).
[2] L Sikkema, et al. An integrated cell atlas of the lung in health and disease. Nature Medicine DOI: 10.1038/s41591-023-02327-2 (2023).
[3] K Siletti, et al. Transcriptomic diversity of cell types across the adult human brain. Science DOI: 10.1126/science.add7046 (2023).
[4] Y Li, et al. A comparative atlas of single-cell chromatin accessibility in the human brain. Science DOI: 10.1126/science.adf7044 (2023).
[5] W Tian, et al. Single-cell DNA methylation and 3D genome architecture in the human brain. Science DOI: 10.1126/science.adf5357 (2023).
[6] N Johansen, et al. Interindividual variation in human cortical cell type abundance and expression. Science DOI: 10.1126/science.adf2359 (2023).
[7] NL Jorstad, et al. Comparative transcriptomics reveals human-specific cortical features. Science DOI: 10.1126/science.ade9516 (2023).
NIH Support: Projects funded through the NIH BRAIN Initiative Cell Consensus Network
Pursuing Precision Medicine for Chronic Kidney Disease
Posted on by Dr. Francis Collins
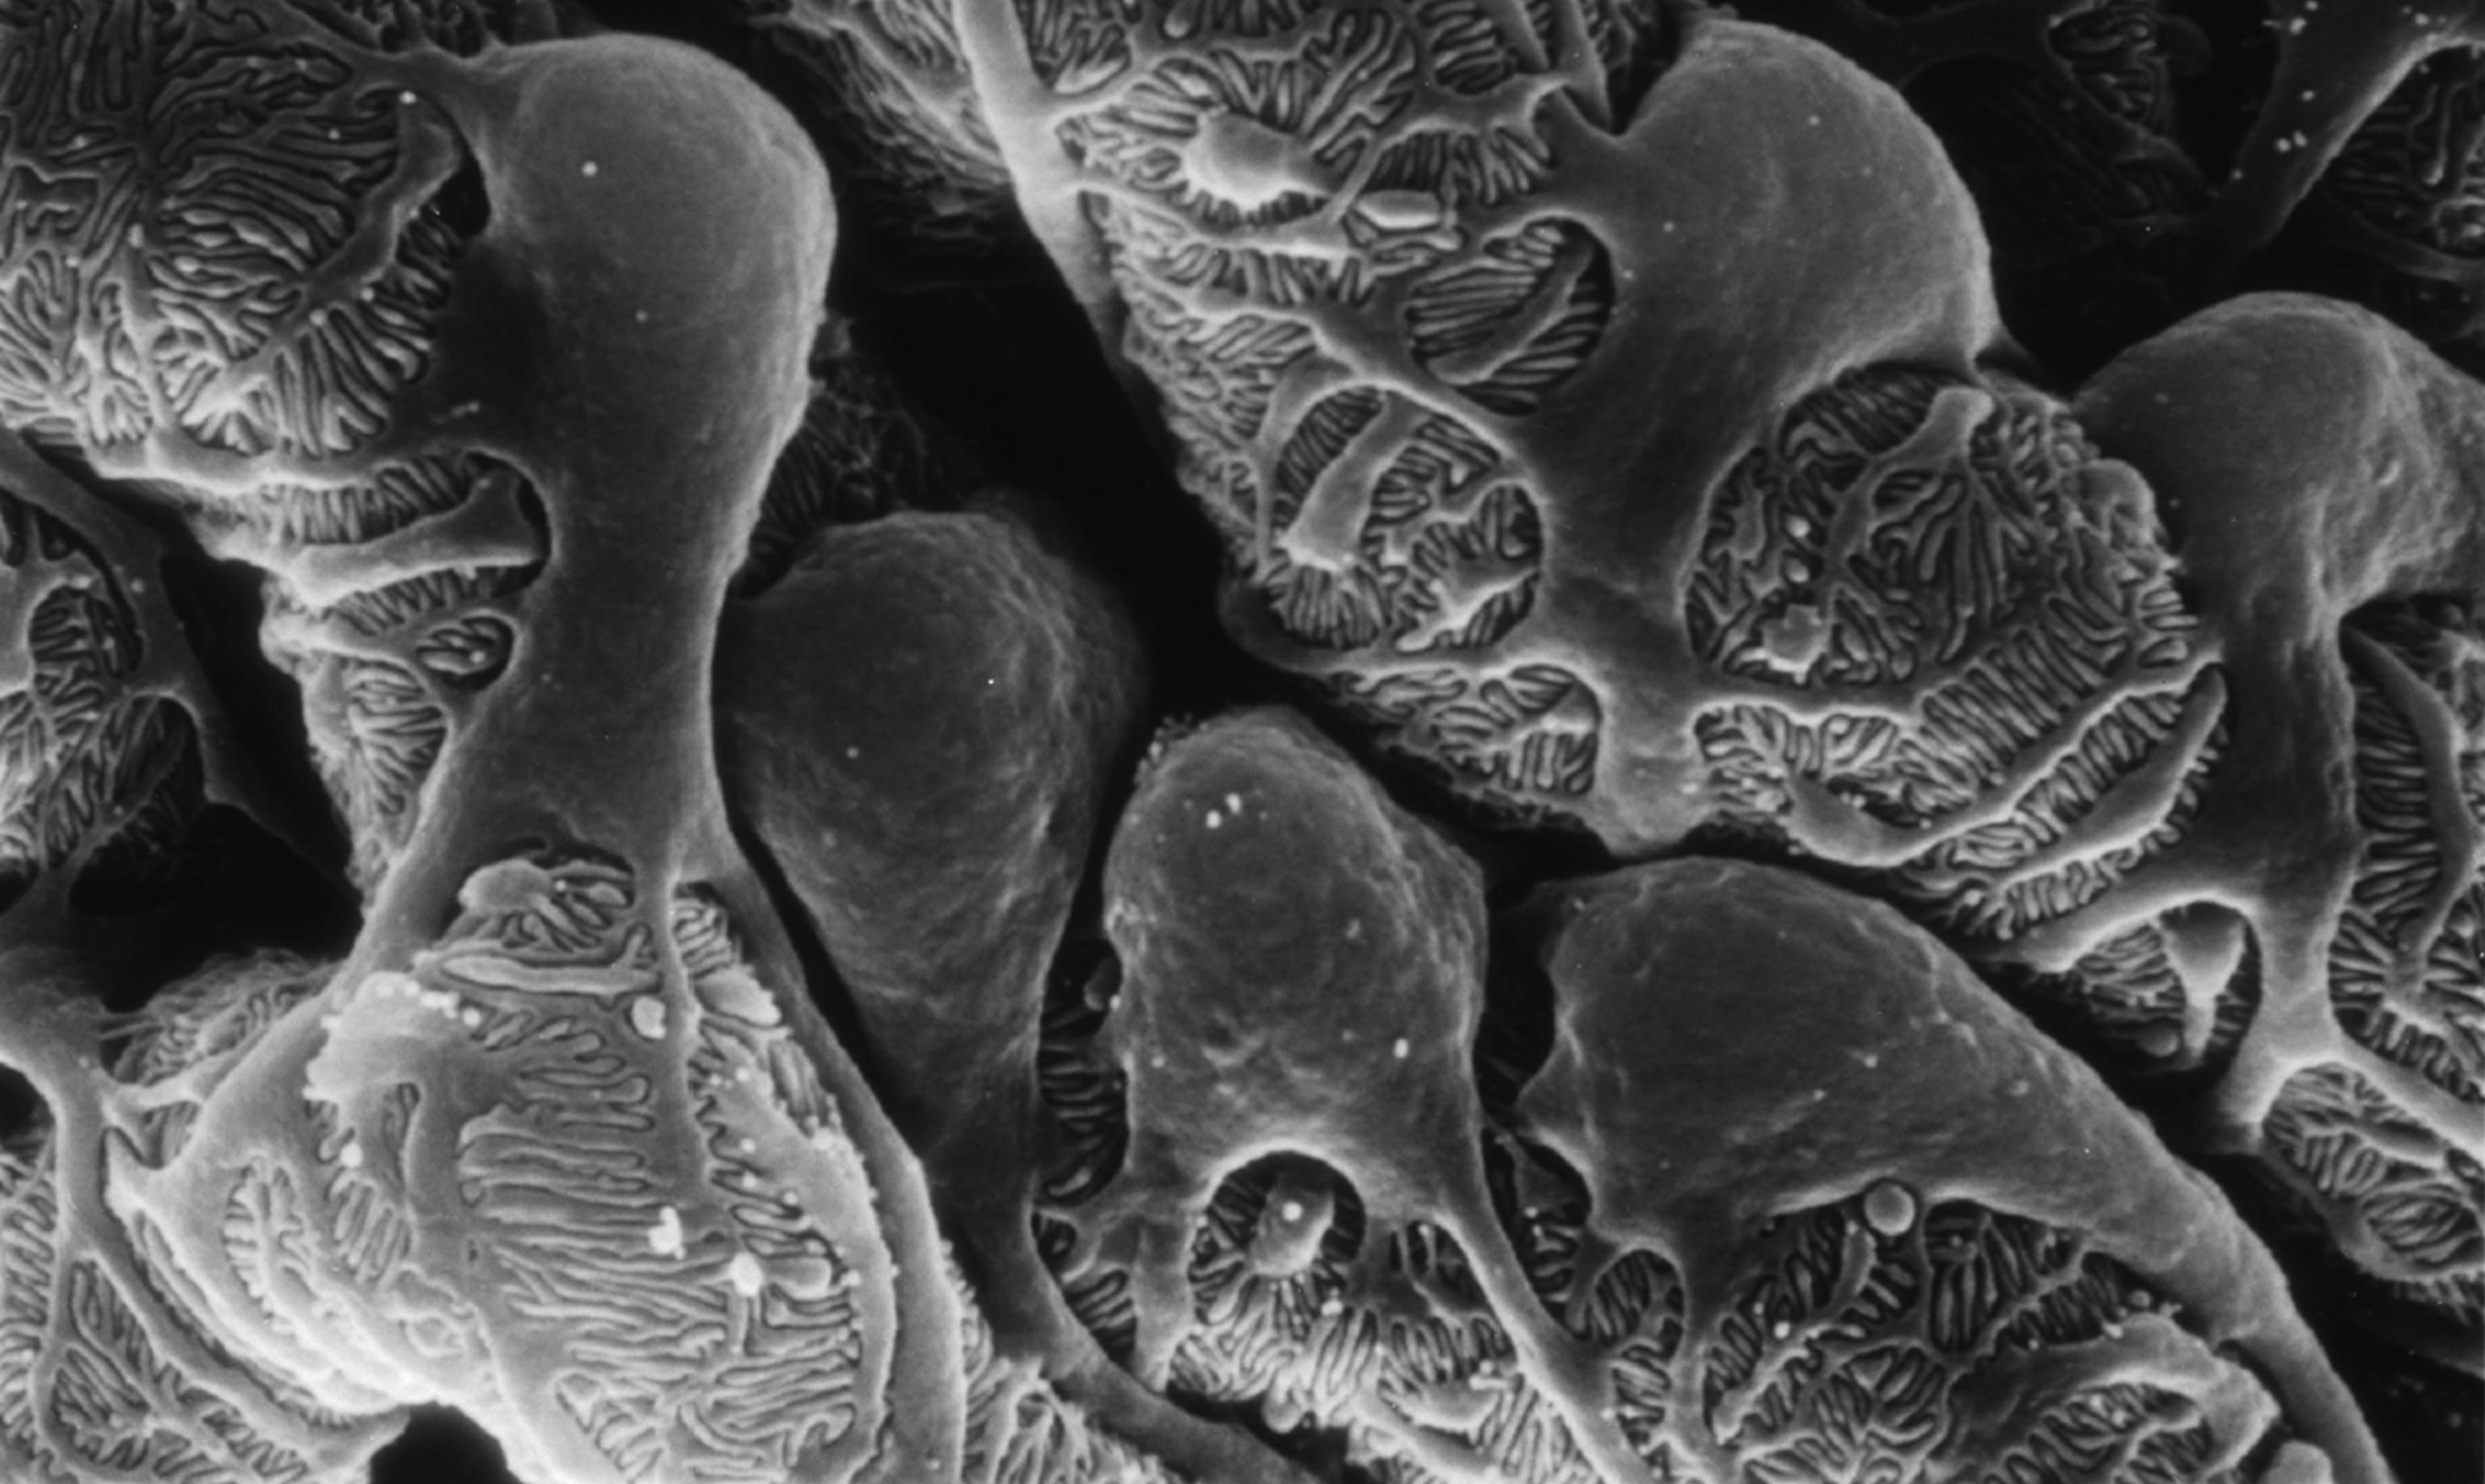
Caption: Scanning electron micrograph showing a part of one of the kidney’s glomerular filters, which are damaged in people with chronic kidney disease (CKD). The cells with the lacy cytoplasmic extensions are called podocytes.
Credit: Kretzler Lab, University of Michigan Health System, Ann Arbor
Every day, our kidneys filter more than 30 gallons of blood to allow excretion of molecules that can harm us if they build up as waste. But, for more than 20 million Americans and a growing number of people around the world, this important function is compromised by chronic kidney disease (CKD) [1]. Some CKD patients are at high risk of progressing to actual kidney failure, treatable only by dialysis or kidney transplants, while others remain generally healthy with stable kidney function for many years with minimal treatment.
The dilemma is that, even when CKD is diagnosed early, there’s been no good way to predict which individuals are at high risk for rapid progression. Those individuals would potentially benefit from more intensive measures to slow or prevent kidney failure, such as drug regimens that tightly control blood pressure and/or blood glucose. So, I’m pleased to report that NIH-funded researchers have made some progress toward developing more precise strategies for identifying individuals at high risk for kidney failure. In recent findings published in Science Translational Medicine [2], an international research team has identified a protein, easily detectable in urine, which appears to serve as an early warning sign of CKD progression.
A wide range of conditions, from diabetes to hypertension to the autoimmune disease lupus, can contribute to the gradual loss of kidney function seen in people with CKD. But research suggests that once kidney damage reaches a critical threshold, it veers off to follow a common downhill course, driven by shared cell signaling pathways and almost independent of the conditions causing it. If there was an easy, reliable way to determine when a CKD patient’s kidneys are approaching this threshold, it could open the door to better strategies for protecting them from kidney failure.
With this need in mind, a team, led by Matthias Kretzler and Wenjun Ju of the University of Michigan, began analyzing gene activity in kidney biopsy samples donated by 164 CKD patients and stored in the European Renal cDNA Bank. Specifically, the researchers looked for patterns of gene activity that corresponded with the patients’ estimated glomerular filtration rates, an indicator of renal function frequently calculated as part of a routine blood workup. Their first pass produced a list of 72 genes that displayed varying levels of activity that corresponded to differences in the patients’ estimated glomerular filtration rates. Importantly, the activity of many of those genes is also increased in cell signaling pathways thought to drive CKD progression.
Further study in two more groups of CKD patients, one from the United States and another from Europe, whittled the list down to three genes that best predicted kidney function. The researchers then zeroed in on the gene that codes for epidermal growth factor (EGF), a protein that, within the kidney, seems to be produced specifically in tubules, which are key components of the waste filtration system. Because EGF appears to enhance tubular repair after injury, researchers had a hunch that it might serve as a positive biomarker of tubular function that could be combined with existing tests of glomerular filtration to detect progression of CKD at an earlier stage.
In groups of CKD patients from the United States and China, the researchers went on to find that the amount of EGF in the urine provides an accurate measure of the protein’s activity in the kidney, making it a promising candidate for a simple urine test. In fact, CKD patients with low levels of EGF in their urine were four times more likely than those with higher EGF levels to have their kidney function worsen within a few years.
These lines of evidence suggest that, if these findings are replicated in additional studies, it may be possible to develop a simple EGF urine test to help identify which individuals with CKD would benefit the most from aggressive disease management and clinical follow-up. Researchers also plan to explore the possibility that such a urine test might prove useful in the early diagnosis of CKD, before there are any other indications of kidney disease. These are very promising new findings, but much remains to be done before we can think of applying these results as standard of care in the clinic. For example, the EGF work needs to be replicated in larger groups of CKD patients, as well as CKD patients with diabetes.
Beyond their implications for CKD, these results demonstrate the power of identifying new biologically important indicators directly from patients and then testing them in large, diverse cohorts of people. I look forward to the day when these sorts of studies will become possible on an even larger scale through our U.S. Precision Medicine Initiative Cohort.
References:
[1] National Chronic Kidney Disease Fact Sheet, 2014. Centers for Disease Control and Prevention.
[2] Tissue transcriptome-driven identification of epidermal growth factor as a chronic kidney disease biomarker. Ju W, Nair V, Smith S, Zhu L, Shedden K, Song PX, Mariani LH, Eichinger FH, Berthier CC, Randolph A, Lai JY, Zhou Y, Hawkins JJ, Bitzer M, Sampson MG, Thier M, Solier C, Duran-Pacheco GC, Duchateau-Nguyen G, Essioux L, Schott B, Formentini I, Magnone MC, Bobadilla M, Cohen CD, Bagnasco SM, Barisoni L, Lv J, Zhang H, Wang HY, Brosius FC, Gadegbeku CA, Kretzler M; ERCB, C-PROBE, NEPTUNE, and PKU-IgAN Consortium. Sci Transl Med. 2015 Dec 2;7(316):316ra193.
Links:
Chronic Kidney Disease: What Does it Mean to Me? (National Institute of Diabetes and Digestive and Kidney Diseases/NIH)
Personalized Molecular Nephrology Research Laboratory (University of Michigan)
C-Probe (University of Michigan)
Precision Medicine Initiative Cohort Program (NIH)
NIH Support: National Center for Advancing Translational Sciences; National Institute of Diabetes and Digestive and Kidney Diseases