neurons
The Amazing Brain: A Sharper Image of the Pyramidal Tract
Posted on by Dr. Francis Collins
Flip the image above upside down, and the shape may remind you of something. If you think it resembles a pyramid, then you and a lot of great neuroscientists are thinking alike. What you are viewing is a colorized, 3D reconstruction of a pyramidal tract, which are bundles of nerve fibers that originate from the brain’s cerebral cortex and relay signals to the brainstem or the spinal cord. These signals control many important activities, including the voluntary movement of our arms, legs, head, and face.
For a while now, it’s been possible to combine a specialized form of magnetic resonance imaging (MRI) with computer modeling tools to produce 3D reconstructions of complicated networks of nerve fibers, such as the pyramidal tract. Still, for technical reasons, the quality of these reconstructions has remained poor in parts of the brain where nerve fibers cross at angles of 40 degrees or less.
The video above demonstrates how adding a sophisticated algorithm, called Orientation Distribution Function (ODF)-Fingerprinting, to such modeling can help overcome this problem when reconstructing a pyramidal tract. It has potential to enhance the reliability of these 3D reconstructions as neurosurgeons begin to use them to plan out their surgeries to help ensure they are carried out with the utmost safety and precision.
In the first second of the video, you see gray, fuzzy images from a diffusion MRI of the pyramidal tract. But, very quickly, a more colorful, detailed 3D reconstruction begins to appear, swiftly filling in from the top down. Colors are used to indicate the primary orientations of the nerve fibers: left to right (red), back to front (green), and top to bottom (blue). The orange, magenta, and other colors represent combinations of these primary directional orientations.
About three seconds into the video, a rough draft of the 3D reconstruction is complete. The top of the pyramidal tract looks pretty good. However, looking lower down, you can see distortions in color and relatively poor resolution of the nerve fibers in the middle of the tract—exactly where the fibers cross each other at angles of less than 40 degrees. So, researchers tapped into the power of their new ODF-Fingerprinting software to improve the image—and, starting about nine seconds into the video, you can see an impressive final result.
The researchers who produced this amazing video are Patryk Filipiak and colleagues in the NIH-supported lab of Steven Baete, Center for Advanced Imaging Innovation and Research, New York University Grossman School of Medicine, New York. The work paired diffusion MRI data from the NIH Human Connectome Project with the ODF-Fingerprinting algorithm, which was created by Baete to incorporate additional MRI imaging data on the shape of nerve fibers to infer their directionality [1].
This innovative approach to imaging recently earned Baete’s team second place in the 2021 “Show Us Your BRAINs” Photo and Video contest, sponsored by the NIH-led Brain Research through Advancing Innovative Neurotechnologies® (BRAIN) Initiative. But researchers aren’t stopping there! They are continuing to refine ODF-Fingerprinting, with the aim of modeling the pyramidal tract in even higher resolution for use in devising new and better ways of helping people undergoing neurosurgery.
Reference:
[1] Fingerprinting Orientation Distribution Functions in diffusion MRI detects smaller crossing angles. Baete SH, Cloos MA, Lin YC, Placantonakis DG, Shepherd T, Boada FE. Neuroimage. 2019 Sep;198:231-241.
Links:
Brain Research through Advancing Innovative Neurotechnologies® (BRAIN) Initiative (NIH)
Human Connectome Project (University of Southern California, Los Angeles)
Steven Baete (Center for Advanced Imaging Innovation and Research, New York University Grossman School of Medicine, New York)
Show Us Your BRAINs! Photo and Video Contest (BRAIN Initiative/NIH)
NIH Support: National Institute of Biomedical Imaging and Bioengineering; National Institute of Neurological Disorders and Stroke; National Cancer Institute
The Amazing Brain: Visualizing Data to Understand Brain Networks
Posted on by Dr. Francis Collins
The NIH-led Brain Research through Advancing Innovative Neurotechnologies® (BRAIN) Initiative continues to teach us about the world’s most sophisticated computer: the human brain. This striking image offers a spectacular case in point, thanks to a new tool called Visual Neuronal Dynamics (VND).
VND is not a camera. It is a powerful software program that can display, animate, and analyze models of neurons and their connections, or networks, using 3D graphics. What you’re seeing in this colorful image is a strip of mouse primary visual cortex, the area in the brain where incoming sensory information gets processed into vision.
This strip contains more than 230,000 neurons of 17 different cell types. Long and spindly excitatory neurons that point upward (purple, blue, red, orange) are intermingled with short and stubby inhibitory neurons (green, cyan, magenta). Slicing through the neuronal landscape is a neuropixels probe (silver): a tiny flexible silicon detector that can record brain activity in awake animals [1].
Developed by Emad Tajkhorshid and his team at University of Illinois at Urbana-Champaign, along with Anton Arkhipov of the Allen Institute, Seattle, VND represents a scientific milestone for neuroscience: using an adept software tool to see and analyze massive neuronal datasets on a computer. What’s also nice is the computer doesn’t have to be a fancy one, and VND’s instructions, or code, are publicly available for anyone to use.
VND is the neuroscience-adapted cousin of Visual Molecular Dynamics (VMD), a popular molecular biology visualization tool to see life up close in 3D, also developed by Tajkhorshid’s group [2]. By modeling and visualizing neurons and their connections, VND helps neuroscientists understand at their desktops how neural networks are organized and what happens when they are manipulated. Those visualizations then lay the groundwork for follow-up lab studies to validate the data and build upon them.
Through the Allen Institute, the NIH BRAIN Initiative is compiling a comprehensive whole-brain atlas of cell types in the mouse, and Arkhipov’s work integrates these data into computer models. In May 2020, his group published comprehensive models of the mouse primary visual cortex [3].
Arkhipov and team are now working to understand how the primary visual cortex’s physical structure (the cell shapes and connections within its complicated circuits) determines its outputs. For example, how do specific connections determine network activity? Or, how fast do cells fire under different conditions?
Ultimately, such computational research may help us understand how brain injuries or disease affect the structure and function of these neural networks. VND should also propel understanding of many other areas of the brain, for which the data are accumulating rapidly, to answer similar questions that still remain mysterious to scientists.
In the meantime, VND is also creating some award-winning art. The image above was the second-place photo in the 2021 “Show us Your BRAINs!” Photo and Video Contest sponsored by the NIH BRAIN Initiative.
References:
[1] Fully integrated silicon probes for high-density recording of neural activity. Jun JJ, Steinmetz NA, Siegle JH, Denman DJ, Bauza M, Barbarits B, Lee AK, Anastassiou CA, Andrei A, Aydın Ç, Barbic M, Blanche TJ, Bonin V, Couto J, Dutta B, Gratiy SL, Gutnisky DA, Häusser M, Karsh B, Ledochowitsch P, Lopez CM, Mitelut C, Musa S, Okun M, Pachitariu M, Putzeys J, Rich PD, Rossant C, Sun WL, Svoboda K, Carandini M, Harris KD, Koch C, O’Keefe J, Harris TD. Nature. 2017 Nov 8;551(7679):232-236.
[2] VMD: visual molecular dynamics. Humphrey W, Dalke A, Schulten K. J Mol Graph. 1996 Feb;14(1):33-8, 27-8.
[3] Systematic integration of structural and functional data into multi-scale models of mouse primary visual cortex. Billeh YN, Cai B, Gratiy SL, Dai K, Iyer R, Gouwens NW, Abbasi-Asl R, Jia X, Siegle JH, Olsen SR, Koch C, Mihalas S, Arkhipov A. Neuron. 2020 May 6;106(3):388-403.e18
Links:
The Brain Research Through Advancing Innovative Neurotechnologies® (BRAIN) Initiative (NIH)
Models of the Mouse Primary Visual Cortex (Allen Institute, Seattle)
Visual Neuronal Dynamics (NIH Center for Macromolecular Modeling and Bioinformatics, University of Illinois at Urbana-Champaign)
Tajkhorshid Lab (University of Illinois at Urbana-Champaign)
Arkhipov Lab (Allen Institute)
Show Us Your BRAINs! Photo & Video Contest (BRAIN Initiative/NIH)
NIH Support: National Institute of Neurological Disorders and Stroke
The Amazing Brain: Toward a Wiring Diagram of Connectivity
Posted on by Dr. Francis Collins
It’s summertime and, thanks to the gift of COVID-19 vaccines, many folks are getting the chance to take a break. So, I think it’s also time that my blog readers finally get a break from what’s been nearly 18 months of non-stop coverage of COVID-19 research. And I can’t think of a more enjoyable way to do that than by taking a look at just a few of the many spectacular images and insights that researchers have derived about the amazing brain.
The Brain Research through Advancing Innovative Neurotechnologies® (BRAIN) Initiative, which is an NIH-led project aimed at revolutionizing our understanding of the human brain, happens to have generated some of the coolest—and most informative—imagery now available in neuroscience. So, throughout the month of August, I’ll share some of the entries from the initiative’s latest Show Us Your BRAINs! Photo and Video Contest.
With nearly 100 billion neurons and 100 trillion connections, the human brain remains one of the greatest mysteries in science. Among the many ways in which neuroscientists are using imaging to solve these mysteries is by developing more detailed maps of connectivity within the brain.
For example, the image featured above from the contest shows a dense weave of neurons in the anterior cingulate cortex, which is the part of the brain involved in learning, memory, and some motor control. In this fluorescence micrograph of tissue from a mouse, each neuron has been labeled with green fluorescent protein, enabling you to see how it connects to other neurons through arm-like projections called axons and dendrites.
The various connections, or circuits, within the brain process and relay distinct types of sensory information. In fact, a single neuron can form a thousand or more of these connections. Among the biggest challenges in biomedicine today is deciphering how these circuits work, and how they can misfire to cause potentially debilitating neurological conditions, including Alzheimer’s disease, Parkinson’s disease, autism, epilepsy, schizophrenia, depression, and traumatic brain injury.
This image was produced by Nicholas Foster and Lei Gao in the NIH-supported lab of Hong Wei Dong, University of California, Los Angeles. The Dong Lab is busy cataloging cell types and helping to assemble a wiring diagram of the connectivity in the mammalian brain—just one of the BRAIN Initiative’s many audacious goals. Stay tuned for more throughout the month of August!
Links:
Brain Research through Advancing Innovative Neurotechnologies® (BRAIN) Initiative (NIH)
Dong Lab (University of California, Los Angeles)
Show Us Your BRAINs! Photo and Video Contest (BRAIN Initiative/NIH)
NIH Support: National Institute of Mental Health
Celebrating the Fourth with Neuroscience Fireworks
Posted on by Dr. Francis Collins
There’s so much to celebrate about our country this Fourth of July. That includes giving thanks to all those healthcare providers who have put themselves in harm’s way to staff the ERs, hospital wards, and ICUs to care for those afflicted with COVID-19, and also for everyone who worked so diligently to develop, test, and distribute COVID-19 vaccines.
These “shots of hope,” created with rigorous science and in record time, are making it possible for a great many Americans to gather safely once again with family and friends. So, if you’re vaccinated (and I really hope you are—because these vaccines have been proven safe and highly effective), fire up the grill, crank up the music, and get ready to show your true red, white, and blue colors. My wife and I—both fully vaccinated—intend to do just that!
To help get the celebration rolling, I’d like to share a couple minutes of some pretty amazing biological fireworks. While the track of a John Philip Sousa march is added just for fun, what you see in the video above is the result of some very serious neuroscience research that is scientifically, as well as visually, breath taking. Credit for this work goes to an NIH-supported team that includes Ricardo Azevedo and Sunil Gandhi, at the Center for the Neurobiology of Learning and Memory, University of California, Irvine, and their collaborator Damian Wheeler, Translucence Biosystems, Irvine, CA. Azevedo is also an NIH National Research Service Award fellow and a Medical Scientist Training Program trainee with Gandhi.
The team’s video starts off with 3D, colorized renderings of a mouse brain at cellular resolution. About 25 seconds in, the video flashes to a bundle of nerve fibers called the fornix. Thanks to the wonders of fluorescent labeling combined with “tissue-clearing” and other innovative technologies, you can clearly see the round cell bodies of individual neurons, along with the long, arm-like axons that they use to send out signals and connect with other neurons to form signaling circuits. The human brain has nearly 100 trillion of these circuits and, when activated, they process incoming sensory information and provide outputs that lead to our thoughts, words, feelings, and actions.
As shown in the video, the nerve fibers of the fornix provide a major output pathway from the hippocampus, a region of the brain involved in memory. Next, we travel to the brain’s neocortex, the outermost part of the brain that’s responsible for complex behaviors, and then move on to explore an intricate structure called the corticospinal tract, which carries motor commands to the spinal cord. The final stop is the olfactory tubercle —towards the base of the frontal lobe—a key player in odor processing and motivated behaviors.
Azevedo and his colleagues imaged the brain in this video in about 40 minutes using their imaging platform called the Translucence Biosystems’ Mesoscale Imaging System™. This process starts with a tissue-clearing method that eliminates light-scattering lipids, leaving the mouse brain transparent. From there, advanced light-sheet microscopy makes thin optical sections of the tissue, and 3D data processing algorithms reconstruct the image to high resolution.
Using this platform, researchers can take brain-wide snapshots of neuronal activity linked to a specific behavior. They can also use it to trace neural circuits that span various regions of the brain, allowing them to form new hypotheses about the brain’s connectivity and how such connectivity contributes to memory and behavior.
The video that you see here is a special, extended version of the team’s first-place video from the NIH-supported BRAIN Initiative’s 2020 “Show Us Your BRAINS!” imaging contest. Because of the great potential of this next-generation technology, Translucence Biosystems has received Small Business Innovation Research grants from NIH’s National Institute of Mental Health to disseminate its “brain-clearing” imaging technology to the neuroscience community.
As more researchers try out this innovative approach, one can only imagine how much more data will be generated to enhance our understanding of how the brain functions in health and disease. That is what will be truly spectacular for everyone working on new and better ways to help people suffering from Alzheimer’s disease, Parkinson’s disease, schizophrenia, autism, epilepsy, traumatic brain injury, depression, and so many other neurological and psychiatric disorders.
Wishing all of you a happy and healthy July Fourth!
Links:
Brain Research Through Advancing Innovative Neurotechnologies® (BRAIN) Initiative (NIH)
NIH National Research Service Award
Medical Scientist Training Program (National Institute of General Medical Sciences/NIH)
Small Business Innovation Research and Small Business Technology Transfer (NIH)
Translucence Biosystems (Irvine, CA)
Sunil Gandhi (University of California, Irvine)
Ricardo Azevedo (University of California, Irvine)
Video: iDISCO-cleared whole brain from a Thy1-GFP mouse (Translucence Biosystems)
Show Us Your BRAINs! Photo & Video Contest (Brain Initiative/NIH)
NIH Support: National Institute of Mental Health; National Eye Institute
Understanding Neuronal Diversity in the Spinal Cord
Posted on by Dr. Francis Collins
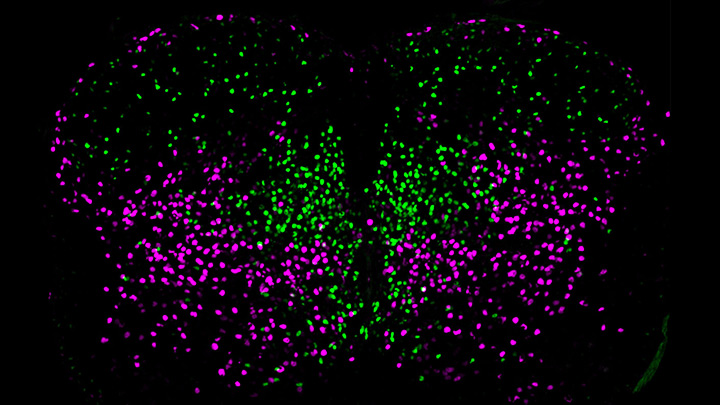
The spinal cord, as a key part of our body’s central nervous system, contains millions of neurons that actively convey sensory and motor (movement) information to and from the brain. Scientists have long sorted these spinal neurons into what they call “cardinal” classes, a classification system based primarily on the developmental origin of each nerve cell. Now, by taking advantage of the power of single-cell genetic analysis, they’re finding that spinal neurons are more diverse than once thought.
This image helps to visualize the story. Each dot represents the nucleus of a spinal neuron in a mouse; humans have a very similar arrangement. Most of these neurons are involved in the regulation of motor control, but they also differ in important ways. Some are involved in local connections (green), such as those that signal outward to a limb and prompt us to pull away reflexively when we touch painful stimuli, such as a hot frying pan. Others are involved in long-range connections (magenta), relaying commands across spinal segments and even upward to the brain. These enable us, for example, to swing our arms while running to help maintain balance.
It turns out that these two types of spinal neurons also have distinctive genetic signatures. That’s why researchers could label them here in different colors and tell them apart. Being able to distinguish more precisely among spinal neurons will prove useful in identifying precisely which ones are affected by a spinal cord injury or neurodegenerative disease, key information in learning to engineer new tissue to heal the damage.
This image comes from a study, published recently in the journal Science, conducted by an NIH-supported team led by Samuel Pfaff, Salk Institute for Biological Studies, La Jolla, CA. Pfaff and his colleagues, including Peter Osseward and Marito Hayashi, realized that the various classes and subtypes of neurons in our spines arose over the course of evolutionary time. They reasoned that the most-primitive original neurons would have gradually evolved subtypes with more specialized and diverse capabilities. They thought they could infer this evolutionary history by looking for conserved and then distinct, specialized gene-expression signatures in the different neural subtypes.
The researchers turned to single-cell RNA sequencing technologies to look for important similarities and differences in the genes expressed in nearly 7,000 mouse spinal neurons. They then used this vast collection of genomic data to group the neurons into closely related clusters, in much the same way that scientists might group related organisms into an evolutionary family tree based on careful study of their DNA.
The first major gene expression pattern they saw divided the spinal neurons into two types: sensory-related and motor-related. This suggested to them that one of the first steps in spinal cord evolution may have been a division of labor of spinal neurons into those two fundamentally important roles.
Further analyses divided the sensory-related neurons into excitatory neurons, which make neurons more likely to fire; and inhibitory neurons, which dampen neural firing. Then, the researchers zoomed in on motor-related neurons and found something unexpected. They discovered the cells fell into two distinct molecular groups based on whether they had long-range or short-range connections in the body. Researches were even more surprised when further study showed that those distinct connectivity signatures were shared across cardinal classes.
All of this means that, while previously scientists had to use many different genetic tags to narrow in on a particular type of neuron, they can now do it with just two: a previously known tag for cardinal class and the newly discovered genetic tag for long-range vs. short-range connections.
Not only is this newfound ability a great boon to basic neuroscientists, it also could prove useful for translational and clinical researchers trying to determine which specific neurons are affected by a spinal injury or disease. Eventually, it may even point the way to strategies for regrowing just the right set of neurons to repair serious neurologic problems. It’s a vivid reminder that fundamental discoveries, such as this one, often can lead to unexpected and important breakthroughs with potential to make a real difference in people’s lives.
Reference:
[1] Conserved genetic signatures parcellate cardinal spinal neuron classes into local and projection subsets. Osseward PJ 2nd, Amin ND, Moore JD, Temple BA, Barriga BK, Bachmann LC, Beltran F Jr, Gullo M, Clark RC, Driscoll SP, Pfaff SL, Hayashi M. Science. 2021 Apr 23;372(6540):385-393.
Links:
What Are the Parts of the Nervous System? (Eunice Kennedy Shriver National Institute of Child Health and Human Development/NIH)
Spinal Cord Injury (National Institute of Neurological Disorders and Stroke/NIH)
Samuel Pfaff (Salk Institute, La Jolla, CA)
NIH Support: National Institute of Mental Health; National Institute of Neurological Disorders and Stroke; Eunice Kennedy Shriver National Institute of Child Health and Human Development
Finding Better Ways to Image the Retina
Posted on by Dr. Francis Collins
Every day, all around the world, eye care professionals are busy performing dilated eye exams. By looking through a patient’s widened pupil, they can view the retina—the postage stamp-sized tissue lining the back of the inner eye—and look for irregularities that may signal the development of vision loss.
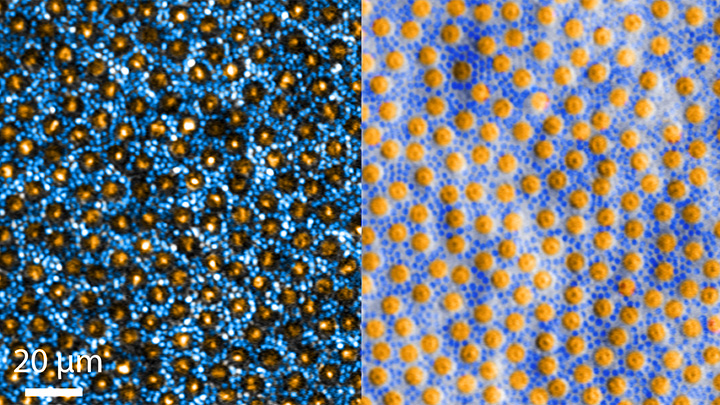
The great news is that, thanks to research, retinal imaging just keeps getting better and better. The images above, which show the same cells viewed with two different microscopic techniques, provide good examples of how tweaking existing approaches can significantly improve our ability to visualize the retina’s two types of light-sensitive neurons: rod and cone cells.
Specifically, these images show an area of the outer retina, which is the part of the tissue that’s observed during a dilated eye exam. Thanks to colorization and other techniques, a viewer can readily distinguish between the light-sensing, color-detecting cone cells (orange) and the much smaller, lowlight-sensing rod cells (blue).
These high-res images come from Johnny Tam, a researcher with NIH’s National Eye Institute. Working with Alfredo Dubra, Stanford University, Palo Alto, CA, Tam and his team figured out how to limit light distortion of the rod cells. The key was illuminating the eye using less light, provided as a halo instead of the usual solid, circular beam.
But the researchers’ solution hit a temporary snag when the halo reflected from the rods and cones created another undesirable ring of light. To block it out, Tam’s team introduced a tiny pinhole, called a sub-Airy disk. Along with use of adaptive optics technology [1] to correct for other distortions of light, the scientists were excited to see such a clear view of individual rods and cones. They published their findings recently in the journal Optica [2]
The resolution produced using these techniques is so much improved (33 percent better than with current methods) that it’s even possible to visualize the tiny inner segments of both rods and cones. In the cones, for example, these inner segments help direct light coming into the eye to other, photosensitive parts that absorb single photons of light. The light is then converted into electrical signals that stream to the brain’s visual centers in the occipital cortex, which makes it possible for us to experience vision.
Tam and team are currently working with physician-scientists in the NIH Clinical Center to image the retinas of people with a variety of retinal diseases, including age-related macular degeneration (AMD), a leading cause of vision loss in older adults. These research studies are ongoing, but offer hopeful possibilities for safe and non-intrusive monitoring of individual rods and cones over time, as well as across disease types. That’s obviously good news for patients. Plus it will help scientists understand how a rod or cone cell stops working, as well as more precisely test the effects of gene therapy and other experimental treatments aimed at restoring vision.
References:
[1] Noninvasive imaging of the human rod photoreceptor mosaic using a confocal adaptive optics scanning ophthalmoscope. Dubra A, Sulai Y, Norris JL, Cooper RF, Dubis AM, Williams DR, Carroll J. Biomed Opt Express. 2011 Jul 1;2(7):1864-76.
[1] In-vivo sub-diffraction adaptive optics imaging of photoreceptors in the human eye with annular pupil illumination and sub-Airy detection. Rongwen L, Aguilera N, Liu T, Liu J, Giannini JP, Li J, Bower AJ, Dubra A, Tam J. Optica 2021 8, 333-343. https://doi.org/10.1364/OPTICA.414206
Links:
Get a Dilated Eye Exam (National Eye Institute/NIH)
How the Eyes Work (NEI)
Eye Health Data and Statistics (NEI)
Tam Lab (NEI)
Dubra Lab (Stanford University, Palo Alto, CA)
NIH Support: National Eye Institute
The Synchronicity of Memory
Posted on by Dr. Francis Collins

You may think that you’re looking at a telescopic heat-map of a distant planet, with clickable thumbnail images to the right featuring its unique topography. In fact, what you’re looking at is a small region of the brain that’s measured in micrometers and stands out as a fascinating frontier of discovery into the very origins of thought and cognition.
It’s a section of a mouse hippocampus, a multi-tasking region of the brain that’s central to memory formation. What makes the image on the left so interesting is it shows four individual neurons (numbered circles) helping to form a memory.
The table of images on the right shows in greater detail how the memory is formed. You see those same four neurons, their activity logged individually. Cooler colors—indigo to turquoise—indicate background or low neuronal activity; warmer colors—yellow to red—indicate high neuronal activity.
Now, take a closer look at the rows of the table that are labeled “Initial.” The four neurons have responded to an initial two-part training session: the sounding of a tone (gray-shaded columns) followed by a stimulus (red-shaded columns) less than a minute later. The neurons, while active (multi-colored pattern), don’t fire in unison or at the same activity levels. A memory has not yet been formed.
That’s not the case just below in the rows labeled “Trained.” After several rounds of reinforcing the one-two sequence, neurons fire together at comparable activity levels in response to the tone (gray) followed by the now-predictable stimulus (red). This process of firing in unison, called neuronal synchronization, encodes the memory. In fact, the four neurons even deactivate in unison after each prompt (unshaded columns).
These fascinating images are the first to show an association between neuronal burst synchronization and hippocampus-dependent memory formation. This discovery has broad implications, from improving memory to reconditioning the mental associations that underlie post-traumatic stress disorder (PTSD).
This research comes from a team led by the NIH-supported investigator Xuanmao Chen, University of New Hampshire, Durham. In the study, published in the FASEB Journal, Chen and colleagues used deep-brain imaging technology to shed new light on some old-fashioned classical conditioning: Pavlovian training [1].
Over a century ago, Ivan Pavlov conducted experiments that conditioned dogs to salivate at the sound of a bell that signaled their feeding time. This concept of “classical conditioning” is central to our understanding of how we humans form certain types of memories. A baby smiles at the sound of her mother’s voice. Stores play holiday music at the end of the year, hoping the positive childhood association puts shoppers in the mood to buy more gifts. Our phone plays a distinctive tone, and we immediately check our text messages. In each example, the association with an otherwise neutral stimulus is learned—and stored in the brain as a “declarative,” or explicit, memory.
The researchers wanted to see what happened in neural cells when mice learned a new association. They applied Pavlov’s learning paradigm, training mice over repeated sessions by pairing an audible tone and, about 30 seconds later, a brief, mild foot stimulus. Mice instinctively halt their activities, or freeze, in response to the foot stimulus. After a few tone-stimulus training sessions, the mice also began freezing after the tone was sounded. They had formed a conditioned response.
During these training sessions, Chen and his colleagues were able to take high-resolution, real-time images of the hippocampus. This allowed them to track the same four neurons over the course of the day—and watch as memory creation, in the form of neuronal synchronization, took place. Later, during recall experiments, the tone itself elicited both the behavioral change and the coordinated neuronal response—if with a bit less regularity. It’s something we humans experience whenever we forget a computer password!
The researchers went on to capture even more evidence. They showed that these neurons, which became part of the stored “engram,” or physical location of the memory, were already active even before they were synchronized. This finding contributes to recent work challenging the long-held paradigm that memory-eligible neurons “switch on” from a silent state to form a memory [2]. The researchers offered a new name for these active neurons: “primed,” as opposed to “silent.”
Chen and his colleagues continue studying the priming process and working out more of the underlying molecular details. They’re attempting to determine how the process is regulated and primed neurons become synchronized. And, of course, the big question: how does this translate into an actual memory in other living creatures? The next round of results should be memorable!
References:
[1] Induction of activity synchronization among primed hippocampal neurons out of random dynamics is key for trace memory formation and retrieval. Zhou Y, Qiu L, Wang H, Chen X. FASEB J. 2020 Mar;34(3):3658–3676.
[2] Memory engrams: Recalling the past and imagining the future. Josselyn S, Tonegawa S. Science 2020 Jan 3;367(6473):eaaw4325.
Links:
Brain Basics: Know Your Brain (National Institute of Neurological Disorders and Stroke/NIH)
Neuroanatomy, Hippocampus Fogwe LA, Reddy V, Mesfin FB. StatPearls Publishing (National Library of Medicine/NIH)
Xuanmao Chen (University of New Hampshire, Durham)
NIH Support: National Institute of Mental Health; National Institute on Aging; National Institute of General Medical Sciences
On-the-Spot Gene Readouts Offer Clues to How Cells Work
Posted on by Dr. Francis Collins

Just as two companies can merge to expand their capabilities, two technologies can become more powerful when integrated into one. That’s why researchers recently merged two breakthrough technologies into one super powerful new method called ExSeq. The two-in-one technology enables researchers for the first time to study an intact tissue sample and track genetic activity on the spot within a cell’s tiniest recesses, or microenvironments—areas that have been largely out of reach until now.
ExSeq, which is described in a paper in the journal Science [1], will unleash many new experimental applications. Beyond enabling more precise analysis of the basic building blocks of life, these applications include analyzing tumor biopsies more comprehensively and even unlocking mysteries of how the brain works. The latter use is on display in this colorful cross-section of a mouse’s hippocampus, a region of the brain involved in the memory of facts and events.
Here you can see in precise and unprecedented detail the areas where genes are activated (magenta) in the brain’s neurons (green). In this particular example, the genes are working within subregions of the hippocampus called the CA1 and dentate gyrus regions (white, bottom and top left).
ExSeq is a joint effort from NIH grantees Ed Boyden, Massachusetts Institute of Technology (MIT), Cambridge, and George Church, Harvard Medical School, Boston. The new method combines a technology called tissue expansion with an in situ sequencing approach.
Tissue expansion swells the contents of tissue sections up to 100 times their normal size but retains their same physical structure [2]. It’s sort of like increasing the font size and line spacing on a hard-to-read document. It makes cellular details that were outside the resolution range of the light microscope suddenly accessible.
With the information inside cells now easier to see, the next step involves a technique called FISSEQ (fluorescent in situ sequencing), which generates readouts of thousands of mRNA molecules in cells [3]. FISSEQ works by detecting individual RNA molecules where they are inside cells and amplifying them into “nanoballs,” or rolled-up copies of themselves. Each nanoball can be read using standard sequencing methods and a fluorescence microscope.
Using the combined ExSeq approach, the team can analyze precisely where gene activity changes within tiny cellular microenvironments. Or, it can compile a more-comprehensive readout of gene activity within cells by analyzing as many gene readouts as detectable. When used in the hippocampus, this untargeted, “agnostic” approach led to some surprises—revealing unusual forms of RNA and, by association, genes for proteins not previously linked with communication between neurons.
Like many technology developments, the scientists envision that ExSeq can be used in many ways, including for more precise analysis of tumor biopsies. To illustrate this point, the researchers analyzed breast cancer metastases, which are cells from breast tumors that have spread to other areas in the body. Metastases contain many different cell types, including cancer cells and immune cells.
Using ExSeq, Boyden and Church learned that these distinct cell types can behave differently depending on where they are inside a tumor. They discovered, for example, that immune B cells near tumor cells expressed certain inflammatory genes at a higher level than immune B cells that were further away. Precise information about a tumor’s composition and activity may lead to development of more targeted approaches to attack it.
Many discoveries come on the heels of transformative new technologies. ExSeq shines a much brighter light on the world of the very small. And that should help us better understand how different parts of cells work together, as well as how cells work with each other in the brain, in cancer, and throughout the body.
References:
[1] Expansion sequencing: Spatially precise in situ transcriptomics in intact biological systems. Alon S, Goodwin DR, Sinha A, Wassie AT, et al. Science. 2021 Jan 29;37:eaax2656.
[2] Expansion microscopy. Chen F, Tillberg PW, Boyden ES. Science. 2015;347:543-548.
[3]. Highly multiplexed subcellular RNA sequencing in situ. Lee JH, Daugharthy ER, Scheiman J, Kalhor R, et al. Science. 2014;343:1360-1363.
Links:
Ribonucleic Acid (RNA) (National Human Genome Research Institute/NIH)
Synthetic Neurobiology Group (Massachusetts Institute of Technology, Cambridge)
George Church (Harvard Medical School, Boston)
NIH Support: National Human Genome Research Institute; National Cancer Institute; National Institute of Biomedical Imaging and Bioengineering; National Institute of Mental Health; National Institute of Neurological Disorders and Stroke
How Our Brains Replay Memories
Posted on by Dr. Francis Collins

Note to my blog readers: the whole world is now facing a major threat from the COVID-19 pandemic. We at NIH are doing everything we can to apply the best and most powerful science to the development of diagnostics, therapeutics, and vaccines, while also implementing public health measures to protect our staff and the patients in our hospital. This crisis is expected to span many weeks, and I will occasionally report on COVID-19 in this blog format. Meanwhile, science continues to progress on many other fronts—and so I will continue to try to bring you stories across a wide range of topics. Perhaps everyone can use a little break now and then from the coronavirus news? Today’s blog takes you into the intricacies of memory.
When recalling the name of an acquaintance, you might replay an earlier introduction, trying to remember the correct combination of first and last names. (Was it Scott James? Or James Scott?) Now, neuroscientists have found that in the split second before you come up with the right answer, your brain’s neurons fire in the same order as when you first learned the information [1].
This new insight into memory retrieval comes from recording the electrical activity of thousands of neurons in the brains of six people during memory tests of random word pairs, such as “jeep” and “crow.” While similar firing patterns had been described before in mice, the new study is the first to confirm that the human brain stores memories in specific sequences of neural activity that can be replayed again and again.
The new study, published in the journal Science, is the latest insight from neurosurgeon and researcher Kareem Zaghloul at NIH’s National Institute of Neurological Disorders and Stroke (NINDS). Zaghloul’s team has for years been involved in an NIH Clinical Center study for patients with drug-resistant epilepsy whose seizures cannot be controlled with drugs.
As part of this work, his surgical team often temporarily places a 4 millimeter-by-4 millimeter array of tiny electrodes on the surface of the brains of the study’s participants. They do this in an effort to pinpoint brain tissues that may be the source of their seizures before performing surgery to remove them. With a patient’s informed consent to take part in additional research, the procedure also has led to a series of insights into what happens in the human brain when we make and later retrieve new memories.
Here’s how it works: The researchers record electrical currents as participants are asked to learn random word pairs presented to them on a computer screen, such as “cake” and “fox,” or “lime” and “camel.” After a period of rest, their brain activity is again recorded as they are given a word and asked to recall the matching word.
Last year, the researchers reported that the split second before a person got the right answer, tiny ripples of electrical activity appeared in two specific areas of the brain [2]. The team also had shown that, when a person correctly recalled a word pair, the brain showed patterns of activity that corresponded to those formed when he or she first learned to make a word association.
The new work takes this a step further. As study participants learned a word pair, the researchers noticed not only the initial rippling wave of electricity, but also that particular neurons in the brain’s cerebral cortex fired repeatedly in a sequential order. In fact, with each new word pair, the researchers observed unique firing patterns among the active neurons.
If the order of neuronal firing was essential for storing new memories, the researchers reasoned that the same would be true for correctly retrieving the information. And, indeed, that’s what they were able to show. For example, when individuals were shown “cake” for a second time, they replayed a very similar firing pattern to the one recorded initially for this word just milliseconds before correctly recalling the paired word “fox.”
The researchers then calculated the average sequence similarity between the firing patterns of learning and retrieval. They found that as a person recalled a word, those patterns gradually became more similar. Just before a correct answer was given, the recorded neurons locked onto the right firing sequence. That didn’t happen when a person gave an incorrect answer.
Further analysis confirmed that the exact order of neural firing was specific to each word pair. The findings show that our memories are encoded as unique sequences that must be replayed for accurate retrieval, though we still don’t understand the molecular mechanisms that undergird this.
Zaghloul reports that there’s still more to learn about how these processes are influenced by other factors such as our attention. It’s not yet known whether the brain replays sequences similarly when retrieving longer-term memories. Along with these intriguing insights into normal learning and memory, the researchers think this line of research will yield important clues as to what changes in people who suffer from memory disorders, with potentially important implications for developing the next generation of treatments.
Reference:
[1] Replay of cortical spiking sequences during human memory retrieval. Vaz AP, Wittig JH Jr, Inati SK, Zaghloul KA. Science. 2020 Mar 6;367(6482):1131-1134.
[2] Coupled ripple oscillations between the medial temporal lobe and neocortex retrieve human memory. Vaz AP, Inati SK, Brunel N, Zaghloul KA. Science. 2019 Mar 1;363(6430):975-978.
Links:
Epilepsy Information Page (National Institute of Neurological Disorders and Stroke/NIH)
Brain Basics (NINDS)
Zaghloul Lab (NINDS)
NIH Support: National Institute of Neurological Disorders and Stroke; National Institute of General Medical Sciences
Largest-Ever Genetic Study of Autism Yields New Insights
Posted on by Dr. Francis Collins

Anyone who’s spent time with people affected by autism spectrum disorder (ASD) can tell you that it’s a very complex puzzle. The wide variability seen among individuals with this group of developmental brain disorders, which can disrupt communication, behavior control, and social skills, has also posed a huge challenge for researchers trying to identify underlying genetic and environmental factors. So, it’s no surprise that there’s been considerable interest in the recent findings of the largest-ever genetic study of ASD.
In a landmark study that analyzed the DNA of more than 35,000 people from around the world, the NIH-funded international Autism Sequencing Consortium (ASC) identified variants in 102 genes associated with increased risk of developing ASD, up from 65 identified previously. Of the 102 genes, 60 had not been previously linked to ASD and 53 appeared to be primarily connected to ASD as opposed to other types of intellectual disability or developmental delay. It is expected that this newfound genetic knowledge will serve to improve understanding of the complex biological mechanisms involved in ASD, ultimately paving the way for new approaches to diagnosis and treatment.
The study reported in the journal Cell was led by Joseph Buxbaum, Icahn School of Medicine at Mount Sinai, New York; Stephan Sanders, University of California, San Francisco; Kathryn Roeder, Carnegie Mellon University, Pittsburgh, PA; and Mark Daly, Massachusetts General Hospital, Boston, MA and the Broad Institute of MIT and Harvard, Cambridge, MA. These researchers and their teams faced what might seem like a rather daunting task.
While common genetic variants collectively are known to contribute substantially to ASD, rare variants have been recognized individually as more major contributors to a person’s risk of developing ASD. The challenge was how to find such rare variants—whether inherited or newly arising.
To do so, the researchers needed to analyze a enormous amount of DNA data. Fortunately, they and their ASC colleagues already had assembled a vast trove of data. Over the last decade, the ASC had collected DNA samples with full consent from thousands of people with and without ASD, including unaffected siblings and parents. All were aggregated with other studies, and, at the time of this investigation, they had gathered 35,584 unique samples. Those included more than 21,000 family-based samples and almost 12,000 samples from people diagnosed with ASD.
In search of rare genetic alterations, they sequenced whole exomes, the approximately 1.5 percent of the genome that codes for proteins. Their search produced a list of 102 ASD-associated genes, including 30 that had never been implicated in any developmental brain disorder previously.
But that was just the beginning. Next, the ASC team dug deeper into this list. The researchers knew from previous work that up to half of people with ASD also have an intellectual disability or developmental delay. Many of the associated genes overlap, meaning they play roles in both outcomes. So, in one set of analyses, the team compared the list to the results of another genetic study of people diagnosed with developmental delays, including problems with learning or gross motor skills such as delayed walking.
The detailed comparison allowed them to discern genes that are more associated with features of ASD, as opposed to those that are more specific to these developmental delays. It turns out that 49 of the 102 autism-associated genes were altered more often in people with developmental delay than in those diagnosed with ASD. The other 53 were altered more often in ASD, suggesting that they may be more closely linked to this condition’s unique features.
Further study also showed that people who carried alterations in genes found predominantly in ASD also had better intellectual function. They also were more likely to have learned to walk without a developmental delay.
The 102 new genes fell primarily into one of two categories. Many play a role in the brain’s neural connections. The rest are involved primarily in switching other genes on and off in brain development. Interestingly, they are expressed both in excitatory neurons, which are active in sending signals in the brain, and in inhibitory neurons that squelch such activity. Many of these genes are also commonly expressed in the brain’s cerebral cortex, the outermost part of the brain that is responsible for many complex behaviors.
Overall, these findings underscore that ASD truly does exist on a spectrum. Indeed, there are many molecular paths to this disorder. The ASC researchers continue to collect samples, so we can expect this list of 102 genes will continue to expand in the future.
With these gene discoveries in hand, the researchers will now also turn their attention to unravelling additional details about how these genes function in the brain. The hope is that this growing list of genes will converge on a smaller number of important molecular pathways, pointing the way to new and more precise ways of treating ASD in all its complexity.
Reference:
[1] Large-scale exome sequencing study implicates both developmental and functional changes in the neurobiology of autism. Satterstrom FK, Kosmicki JA, Wang J, Breen MS, De Rubeis S, An JY, Peng M, Collins R, Grove J, Klei L, Stevens C, Reichert J, Mulhern MS, Artomov M, Gerges S, Sheppard B, Xu X, Bhaduri A, Norman U, Brand H, Schwartz G, Nguyen R, Guerrero EE, Dias C; Autism Sequencing Consortium; iPSYCH-Broad Consortium, Betancur C, Cook EH, Gallagher L, Gill M, Sutcliffe JS, Thurm A, Zwick ME, Børglum AD, State MW, Cicek AE, Talkowski ME, Cutler DJ, Devlin B, Sanders SJ, Roeder K, Daly MJ, Buxbaum JD.Cell. 2020 Jan 23. {Epub ahead of print]
Links:
Autism Spectrum Disorder (NIH/National Institute of Mental Health)
Joseph Buxbaum (Icahn School of Medicine at Mount Sinai, New York)
Sanders Lab (University of California, San Francisco)
Kathryn Roeder (Carnegie Mellon University, Pittsburgh, PA)
Mark Daly (Broad Institute of MIT and Harvard, Cambridge, MA)
Autism Sequencing Consortium (Emory University, Atlanta)
NIH Support: National Institute Mental Health; National Human Genome Research Institute
Previous Page Next Page