imaging
The Amazing Brain: Capturing Neurons in Action
Posted on by Lawrence Tabak, D.D.S., Ph.D.
With today’s powerful imaging tools, neuroscientists can monitor the firing and function of many distinct neurons in our brains, even while we move freely about. They also possess another set of tools to capture remarkable, high-resolution images of the brain’s many thousands of individual neurons, tracing the form of each intricate branch of their tree-like structures.
Most brain imaging approaches don’t capture neural form and function at once. Yet that’s precisely what you’re seeing in this knockout of a movie, another winner in the Show Us Your BRAINs! Photo and Video Contest, supported by NIH’s Brain Research through Advancing Innovative Neurotechnologies® (BRAIN) Initiative.
This first-of-its kind look into the mammalian brain produced by Andreas Tolias, Baylor College of Medicine, Houston, and colleagues features about 200 neurons in the visual cortex, which receives and processes visual information. First, you see a colorful, tightly packed network of neurons. Then, those neurons, which were colorized by the researchers in vibrant pinks, reds, blues, and greens, pull apart to reveal their finely detailed patterns and shapes. Throughout the video, you can see neural activity, which appears as flashes of white that resemble lightning bolts.
Making this movie was a multi-step process. First, the Tolias group presented laboratory mice with a series of visual cues, using a functional imaging approach called two-photon calcium imaging to record the electrical activity of individual neurons. While this technique allowed the researchers to pinpoint the precise locations and activity of each individual neuron in the visual cortex, they couldn’t zoom in to see their precise structures.
So, the Baylor team sent the mice to colleagues Nuno da Costa and Clay Reid, Allen Institute for Brain Science, Seattle, who had the needed electron microscopes and technical expertise to zoom in on these structures. Their data allowed collaborator Sebastian Seung’s team, Princeton University, Princeton, NJ, to trace individual neurons in the visual cortex along their circuitous paths. Finally, they used sophisticated machine learning algorithms to carefully align the two imaging datasets and produce this amazing movie.
This research was supported by Intelligence Advanced Research Projects Activity (IARPA), part of the Office of the Director of National Intelligence. The IARPA is one of NIH’s governmental collaborators in the BRAIN Initiative.
Tolias and team already are making use of their imaging data to learn more about the precise ways in which individual neurons and groups of neurons in the mouse visual cortex integrate visual inputs to produce a coherent view of the animals’ surroundings. They’ve also collected an even-larger data set, scaling their approach up to tens of thousands of neurons. Those data are now freely available to other neuroscientists to help advance their work. As researchers make use of these and similar data, this union of neural form and function will surely yield new high-resolution discoveries about the mammalian brain.
Links:
Tolias Lab (Baylor College of Medicine, Houston)
Nuno da Costa (Allen Institute for Brain Science, Seattle)
R. Clay Reid (Allen Institute)
H. Sebastian Seung (Princeton University, Princeton, NJ)
Machine Intelligence from Cortical Networks (MICrONS) Explorer
Brain Research through Advancing Innovative Neurotechnologies® (BRAIN) Initiative (NIH)
Show Us Your BRAINs Photo & Video Contest (BRAIN Initiative)
NIH Support: BRAIN Initiative; Common Fund
Human Brain Compresses Working Memories into Low-Res ‘Summaries’
Posted on by Lawrence Tabak, D.D.S., Ph.D.
You have probably done it already a few times today. Paused to remember a password, a shopping list, a phone number, or maybe the score to last night’s ballgame. The ability to store and recall needed information, called working memory, is essential for most of the human brain’s higher cognitive processes.
Researchers are still just beginning to piece together how working memory functions. But recently, NIH-funded researchers added an intriguing new piece to this neurobiological puzzle: how visual working memories are “formatted” and stored in the brain.
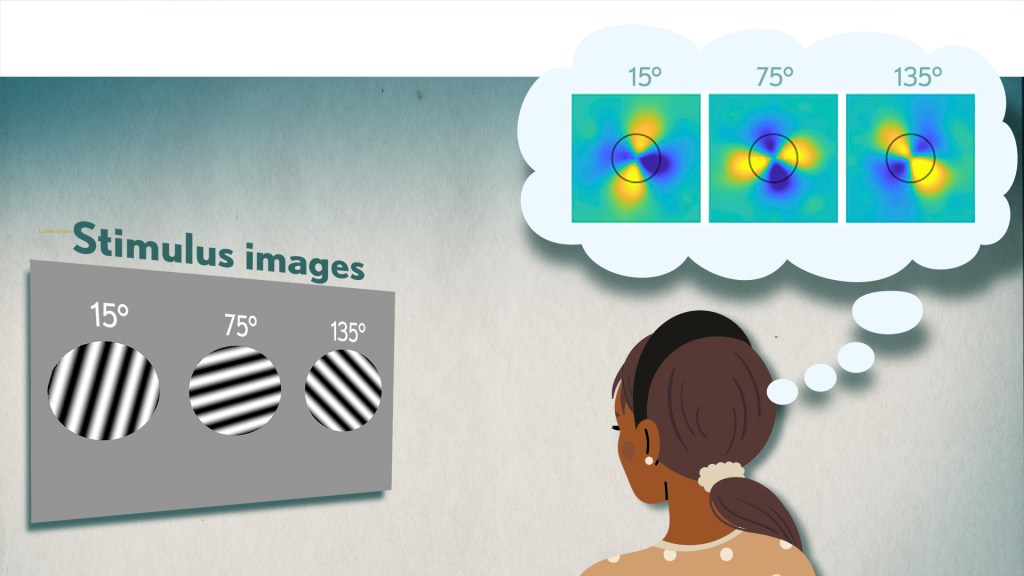
The findings, published in the journal Neuron, show that the visual cortex—the brain’s primary region for receiving, integrating, and processing visual information from the eye’s retina—acts more like a blackboard than a camera. That is, the visual cortex doesn’t photograph all the complex details of a visual image, such as the color of paper on which your password is written or the precise series of lines that make up the letters. Instead, it recodes visual information into something more like simple chalkboard sketches.
The discovery suggests that those pared down, low-res representations serve as a kind of abstract summary, capturing the relevant information while discarding features that aren’t relevant to the task at hand. It also shows that different visual inputs, such as spatial orientation and motion, may be stored in virtually identical, shared memory formats.
The new study, from Clayton Curtis and Yuna Kwak, New York University, New York, builds upon a known fundamental aspect of working memory. Many years ago, it was determined that the human brain tends to recode visual information. For instance, if passed a 10-digit phone number on a card, the visual information gets recoded and stored in the brain as the sounds of the numbers being read aloud.
Curtis and Kwak wanted to learn more about how the brain formats representations of working memory in patterns of brain activity. To find out, they measured brain activity with functional magnetic resonance imaging (fMRI) while participants used their visual working memory.
In each test, study participants were asked to remember a visual stimulus presented to them for 12 seconds and then make a memory-based judgment on what they’d just seen. In some trials, as shown in the image above, participants were shown a tilted grating, a series of black and white lines oriented at a particular angle. In others, they observed a cloud of dots, all moving in a direction to represent those same angles. After a short break, participants were asked to recall and precisely indicate the angle of the grating’s tilt or the dot cloud’s motion as accurately as possible.
It turned out that either visual stimulus—the grating or moving dots—resulted in the same patterns of neural activity in the visual cortex and parietal cortex. The parietal cortex is a part of the brain used in memory processing and storage.
These two distinct visual memories carrying the same relevant information seemed to have been recoded into a shared abstract memory format. As a result, the pattern of brain activity trained to recall motion direction was indistinguishable from that trained to recall the grating orientation.
This result indicated that only the task-relevant features of the visual stimuli had been extracted and recoded into a shared memory format. But Curtis and Kwak wondered whether there might be more to this finding.
To take a closer look, they used a sophisticated model that allowed them to project the three-dimensional patterns of brain activity into a more-informative, two-dimensional representation of visual space. And, indeed, their analysis of the data revealed a line-like pattern, similar to a chalkboard sketch that’s oriented at the relevant angles.
The findings suggest that participants weren’t actually remembering the grating or a complex cloud of moving dots at all. Instead, they’d compressed the images into a line representing the angle that they’d been asked to remember.
Many questions remain about how remembering a simple angle, a relatively straightforward memory formation, will translate to the more-complex sets of information stored in our working memory. On a technical level, though, the findings show that working memory can now be accessed and captured in ways that hadn’t been possible before. This will help to delineate the commonalities in working memory formation and the possible differences, whether it’s remembering a password, a shopping list, or the score of your team’s big victory last night.
Reference:
[1] Unveiling the abstract format of mnemonic representations. Kwak Y, Curtis CE. Neuron. 2022, April 7; 110(1-7).
Links:
Working Memory (National Institute of Mental Health/NIH)
The Curtis Lab (New York University, New York)
NIH Support: National Eye Institute
Capturing the Extracellular Matrix in 3D Color
Posted on by Dr. Francis Collins
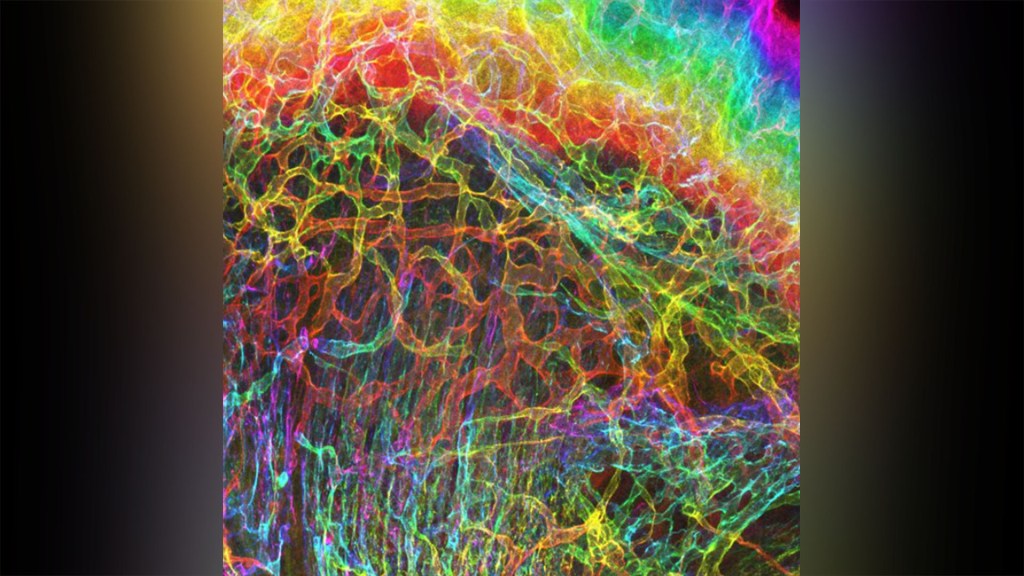
For experienced and aspiring shutterbugs alike, sometimes the best photo in the bunch turns out to be a practice shot. That’s also occasionally true in the lab when imaging cells and tissues, and it’s the story behind this spectacular image showing the interface of skin and muscle during mammalian development.
Here you see an area of the mouse forelimb located near a bone called the humerus. This particular sample was labeled for laminin, a protein found in the extracellular matrix (ECM) that undergirds cells and tissues to give them mechanical and biochemical support. Computer algorithms were used to convert the original 2D confocal scan into a 3D image, and colorization was added to bring the different layers of tissue into sharper relief.
Skin tissue (bright red and yellow) is located near the top of the image; blood vessels (paler red, orange, and yellow) are in the middle and branching downward; and muscle (green, blue, and purple) makes up the bottom layer.
The image was created by Sarah Lipp, a graduate student in the NIH-supported tissue engineering lab of Sarah Calve. The team focuses on tissue interfaces to better understand the ECM and help devise strategies to engineer musculoskeletal tissues, such as tendon and cartilage.
In February 2020, Lipp was playing around with some new software tools for tissue imaging. Before zeroing in on her main target—the mouse’s myotendinous junction, where muscle transfers its force to tendon, Lipp snapped this practice shot of skin meeting muscle. After processing the practice shot with a color-projecting macro in an image processing tool called Fiji, she immediately liked what she saw.
So, Lipp tweaked the color a bit more and entered the image in the 2020 BioArt Scientific Image & Video Competition, sponsored by the Federation of American Societies for Experimental Biology, Bethesda, MD. Last December, the grad student received the good news that her practice shot had snagged one of the prestigious contest’s top awards.
But she’s not stopping there. Lipp is continuing to pursue her research interests at the University of Colorado, Boulder, where the Calve lab recently moved from Purdue University, West Lafayette, IN. Here’s wishing her a career filled with more great images—and great science!
Links:
Muscle and Bone Diseases (National Institute of Arthritis and Musculoskeletal and Skin Diseases/NIH)
Musculoskeletal Extracellular Matrix Laboratory (University of Colorado, Boulder)
BioArt Scientific Image & Video Competition (Federation of American Societies for Experimental Biology, Bethesda, MD)
NIH Support: National Institute of Arthritis and Musculoskeletal and Skin Diseases
Tapping Into The Brain’s Primary Motor Cortex
Posted on by Dr. Francis Collins
If you’re like me, you might catch yourself during the day in front of a computer screen mindlessly tapping your fingers. (I always check first to be sure my mute button is on!) But all that tapping isn’t as mindless as you might think.
While a research participant performs a simple motor task, tapping her fingers together, this video shows blood flow within the folds of her brain’s primary motor cortex (gray and white), which controls voluntary movement. Areas of high brain activity (yellow and red) emerge in the omega-shaped “hand-knob” region, the part of the brain controlling hand movement (right of center) and then further back within the primary somatic cortex (which borders the motor cortex toward the back of the head).
About 38 seconds in, the right half of the video screen illustrates that the finger tapping activates both superficial and deep layers of the primary motor cortex. In contrast, the sensation of a hand being brushed (a sensory task) mostly activates superficial layers, where the primary sensory cortex is located. This fits with what we know about the superficial and deep layers of the hand-knob region, since they are responsible for receiving sensory input and generating motor output to control finger movements, respectively [1].
The video showcases a new technology called zoomed 7T perfusion functional MRI (fMRI). It was an entry in the recent Show Us Your BRAINs! Photo and Video Contest, supported by NIH’s Brain Research Through Advancing Innovative Neurotechnologies® (BRAIN) Initiative.
The technology is under development by an NIH-funded team led by Danny J.J. Wang, University of Southern California Mark and Mary Stevens Neuroimaging and Informatics Institute, Los Angeles. Zoomed 7T perfusion fMRI was developed by Xingfeng Shao and brought to life by the group’s medical animator Jim Stanis.
Measuring brain activity using fMRI to track perfusion is not new. The brain needs a lot of oxygen, carried to it by arteries running throughout the head, to carry out its many complex functions. Given the importance of oxygen to the brain, you can think of perfusion levels, measured by fMRI, as a stand-in measure for neural activity.
There are two things that are new about zoomed 7T perfusion fMRI. For one, it uses the first ultrahigh magnetic field imaging scanner approved by the Food and Drug Administration. The technology also has high sensitivity for detecting blood flow changes in tiny arteries and capillaries throughout the many layers of the cortex [2].
Compared to previous MRI methods with weaker magnets, the new technique can measure blood flow on a fine-grained scale, enabling scientists to remove unwanted signals (“noise”) such as those from surface-level arteries and veins. Getting an accurate read-out of activity from region to region across cortical layers can help scientists understand human brain function in greater detail in health and disease.
Having shown that the technology works as expected during relatively mundane hand movements, Wang and his team are now developing the approach for fine-grained 3D mapping of brain activity throughout the many layers of the brain. This type of analysis, known as mesoscale mapping, is key to understanding dynamic activities of neural circuits that connect brain cells across cortical layers and among brain regions.
Decoding circuits, and ultimately rewiring them, is a major goal of NIH’s BRAIN Initiative. Zoomed 7T perfusion fMRI gives us a window into 4D biology, which is the ability to watch 3D objects over time scales in which life happens, whether it’s playing an elaborate drum roll or just tapping your fingers.
References:
[1] Neuroanatomical localization of the ‘precentral knob’ with computed tomography imaging. Park MC, Goldman MA, Park MJ, Friehs GM. Stereotact Funct Neurosurg. 2007;85(4):158-61.
[2]. Laminar perfusion imaging with zoomed arterial spin labeling at 7 Tesla. Shao X, Guo F, Shou Q, Wang K, Jann K, Yan L, Toga AW, Zhang P, Wang D.J.J bioRxiv 2021.04.13.439689.
Links:
Brain Basics: Know Your Brain (National Institute of Neurological Disorders and Stroke)
Laboratory of Functional MRI Technology (University of Southern California Mark and Mary Stevens Neuroimaging and Informatics Institute)
The Brain Research Through Advancing Innovative Neurotechnologies® (BRAIN) Initiative (NIH)
Show Us Your BRAINs! Photo and Video Contest (BRAIN Initiative)
NIH Support: National Institute of Neurological Disorders and Stroke; National Institute of Biomedical Imaging and Bioengineering; Office of the Director
The Amazing Brain: Motor Neurons of the Cervical Spine
Posted on by Dr. Francis Collins
Today, you may have opened a jar, done an upper body workout, played a guitar or a piano, texted a friend, or maybe even jotted down a grocery list longhand. All of these “skilled” arm, wrist, and hand movements are made possible by the bundled nerves, or circuits, running through a part of the central nervous system in the neck area called the cervical spine.
This video, which combines sophisticated imaging and computation with animation, shows the density of three types of nerve cells in the mouse cervical spine. There are the V1 interneurons (red), which sit between sensory and motor neurons; motor neurons associated with controlling the movement of the bicep (blue); and motor neurons associated with controlling the tricep (green).
At 4 seconds, the 3D animation morphs to show all the colors and cells intermixed as they are naturally in the cervical spine. At 8 seconds, the animation highlights the density of these three cells types. Notice in the bottom left corner, a light icon appears indicating the different imaging perspectives. What’s unique here is the frontal, or rostral, view of the cervical spine. The cervical spine is typically imaged from a lateral, or side, perspective.
Starting at 16 seconds, the animation highlights the location and density of each of the individual neurons. For the grand finale, viewers zoom off on a brief fly-through of the cervical spine and a flurry of reds, blues, and greens.
The video comes from Jamie Anne Mortel, a research assistant in the lab of Samuel Pfaff, Salk Institute, La Jolla, CA. Mortel is part of a team supported by the NIH-led Brain Research through Advancing Innovative Neurotechnologies® (BRAIN) Initiative that’s developing a comprehensive atlas of the circuitry within the cervical spine that controls how mice control their forelimb movements, such as reaching and grasping.
This basic research will provide a better understanding of how the mammalian brain and spinal cord work together to produce movement. More than that, this research may provide valuable clues into better treating paralysis to arms, wrists, and/or hands caused by neurological diseases and spinal cord injuries.
As a part of this project, the Pfaff lab has been busy developing a software tool to take their imaging data from different parts of the cervical spine and present it in 3D. Mortel, who likes to make cute cartoon animations in her spare time, noticed that the software lacked animation capability. So she took the initiative and spent the next three weeks working after hours to produce this video—her first attempt at scientific animation. No doubt she must have been using a lot of wrist and hand movements!
With a positive response from her Salk labmates, Mortel decided to enter her scientific animation debut in the 2021 Show Us BRAINs! Photo and Video Contest. To her great surprise and delight, Mortel won third place in the video competition. Congratulations, and continued success for you and the team in producing this much-needed atlas to define the circuitry underlying skilled arm, wrist, and hand movements.
Links:
Brain Research through Advancing Innovative Neurotechnologies® (BRAIN) Initiative (NIH)
Spinal Cord Injury Information Page (National Institute of Neurological Disorders and Stroke/NIH)
Samuel Pfaff (Salk Institute, La Jolla, CA)
Show Us Your BRAINs! Photo and Video Contest (Brain Initiative/NIH)
NIH Support: National Institute of Neurological Disorders and Stroke
The Amazing Brain: Tracking Molecular Events with Calling Cards
Posted on by Dr. Francis Collins
In days mostly gone by, it was fashionable in some circles for people to hand out calling cards to mark their arrival at special social events. This genteel human tradition is now being adapted to the lab to allow certain benign viruses to issue their own high-tech calling cards and mark their arrival at precise locations in the genome. These special locations show where there’s activity involving transcription factors, specialized proteins that switch genes on and off and help determine cell fate.
The idea is that myriad, well-placed calling cards can track brain development over time in mice and detect changes in transcription factor activity associated with certain neuropsychiatric disorders. This colorful image, which won first place in this year’s Show Us Your BRAINs! Photo and Video contest, provides a striking display of these calling cards in action in living brain tissue.
The image comes from Allen Yen, a PhD candidate in the lab of Joseph Dougherty, collaborating with the nearby lab of Rob Mitra. Both labs are located in the Washington University School of Medicine, St. Louis.
Yen and colleagues zoomed in on this section of mouse brain tissue under a microscope to capture dozens of detailed images that they then stitched together to create this high-resolution overview. The image shows neural cells (red) and cell nuclei (blue). But focus in on the neural cells (green) concentrated in the brain’s outer cortex (top) and hippocampus (two lobes in the upper center). They’ve been labelled with calling cards that were dropped off by adeno-associated virus [1].
Once dropped off, a calling card doesn’t bear a pretentious name or title. Rather, the calling card, is a small mobile snippet of DNA called a transposon. It gets dropped off with the other essential component of the technology: a specialized enzyme called a transposase, which the researchers fuse to one of many specific transcription factors of interest.
Each time one of these transcription factors of interest binds DNA to help turn a gene on or off, the attached transposase “grabs” a transposon calling card and inserts it into the genome. As a result, it leaves behind a permanent record of the interaction.
What’s also nice is the calling cards are programmed to give away their general locations. That’s because they encode a fluorescent marker (in this image, it’s a green fluorescent protein). In fact, Yen and colleagues could look under a microscope and tell from all the green that their calling card technology was in place and working as intended.
The final step, though, was to find out precisely where in the genome those calling cards had been left. For this, the researchers used next-generation sequencing to produce a cumulative history and map of each and every calling card dropped off in the genome.
These comprehensive maps allow them to identify important DNA-protein binding events well after the fact. This innovative technology also enables scientists to attribute past molecular interactions with observable developmental outcomes in a way that isn’t otherwise possible.
While the Mitra and Dougherty labs continue to improve upon this technology, it’s already readily adaptable to answer many important questions about the brain and brain disorders. In fact, Yen is now applying the technology to study neurodevelopment in mouse models of neuropsychiatric disorders, specifically autism spectrum disorder (ASD) [2]. This calling card technology also is available for any lab to deploy for studying a transcription factor of interest.
This research is supported by the Brain Research through Advancing Innovative Neurotechnologies® (BRAIN) Initiative. One of the major goals of BRAIN Initiative is to accelerate the development and application of innovative technologies to gain new understanding of the brain. This award-winning image is certainly a prime example of striving to meet this goal. I’ll look forward to what these calling cards will tell us in the future about ASD and other important neurodevelopmental conditions affecting the brain.
References:
[1] A viral toolkit for recording transcription factor-DNA interactions in live mouse tissues. Cammack AJ, Moudgil A, Chen J, Vasek MJ, Shabsovich M, McCullough K, Yen A, Lagunas T, Maloney SE, He J, Chen X, Hooda M, Wilkinson MN, Miller TM, Mitra RD, Dougherty JD. Proc Natl Acad Sci U S A. 2020 May 5;117(18):10003-10014.
[2] A MYT1L Syndrome mouse model recapitulates patient phenotypes and reveals altered brain development due to disrupted neuronal maturation. Jiayang Chen, Mary E. Lambo, Xia Ge, Joshua T. Dearborn, Yating Liu, Katherine B. McCullough, Raylynn G. Swift, Dora R. Tabachnick, Lucy Tian, Kevin Noguchi, Joel R. Garbow, John N. Constantino. bioRxiv. May 27, 2021.
Links:
Brain Research through Advancing Innovative Neurotechnologies® (BRAIN) Initiative (NIH)
Autism Spectrum Disorder (National Institute of Mental Health/NIH)
Dougherty Lab (Washington University School of Medicine, St. Louis)
Mitra Lab (Washington University School of Medicine)
Show Us Your BRAINs! Photo and Video Contest (BRAIN Initiative/NIH)
NIH Support: National Institute of Neurological Disorders and Stroke; National Institute of Mental Health; National Center for Advancing Translational Sciences; National Human Genome Research Institute; National Institute of General Medical Sciences
Celebrating the Fourth with Neuroscience Fireworks
Posted on by Dr. Francis Collins
There’s so much to celebrate about our country this Fourth of July. That includes giving thanks to all those healthcare providers who have put themselves in harm’s way to staff the ERs, hospital wards, and ICUs to care for those afflicted with COVID-19, and also for everyone who worked so diligently to develop, test, and distribute COVID-19 vaccines.
These “shots of hope,” created with rigorous science and in record time, are making it possible for a great many Americans to gather safely once again with family and friends. So, if you’re vaccinated (and I really hope you are—because these vaccines have been proven safe and highly effective), fire up the grill, crank up the music, and get ready to show your true red, white, and blue colors. My wife and I—both fully vaccinated—intend to do just that!
To help get the celebration rolling, I’d like to share a couple minutes of some pretty amazing biological fireworks. While the track of a John Philip Sousa march is added just for fun, what you see in the video above is the result of some very serious neuroscience research that is scientifically, as well as visually, breath taking. Credit for this work goes to an NIH-supported team that includes Ricardo Azevedo and Sunil Gandhi, at the Center for the Neurobiology of Learning and Memory, University of California, Irvine, and their collaborator Damian Wheeler, Translucence Biosystems, Irvine, CA. Azevedo is also an NIH National Research Service Award fellow and a Medical Scientist Training Program trainee with Gandhi.
The team’s video starts off with 3D, colorized renderings of a mouse brain at cellular resolution. About 25 seconds in, the video flashes to a bundle of nerve fibers called the fornix. Thanks to the wonders of fluorescent labeling combined with “tissue-clearing” and other innovative technologies, you can clearly see the round cell bodies of individual neurons, along with the long, arm-like axons that they use to send out signals and connect with other neurons to form signaling circuits. The human brain has nearly 100 trillion of these circuits and, when activated, they process incoming sensory information and provide outputs that lead to our thoughts, words, feelings, and actions.
As shown in the video, the nerve fibers of the fornix provide a major output pathway from the hippocampus, a region of the brain involved in memory. Next, we travel to the brain’s neocortex, the outermost part of the brain that’s responsible for complex behaviors, and then move on to explore an intricate structure called the corticospinal tract, which carries motor commands to the spinal cord. The final stop is the olfactory tubercle —towards the base of the frontal lobe—a key player in odor processing and motivated behaviors.
Azevedo and his colleagues imaged the brain in this video in about 40 minutes using their imaging platform called the Translucence Biosystems’ Mesoscale Imaging System™. This process starts with a tissue-clearing method that eliminates light-scattering lipids, leaving the mouse brain transparent. From there, advanced light-sheet microscopy makes thin optical sections of the tissue, and 3D data processing algorithms reconstruct the image to high resolution.
Using this platform, researchers can take brain-wide snapshots of neuronal activity linked to a specific behavior. They can also use it to trace neural circuits that span various regions of the brain, allowing them to form new hypotheses about the brain’s connectivity and how such connectivity contributes to memory and behavior.
The video that you see here is a special, extended version of the team’s first-place video from the NIH-supported BRAIN Initiative’s 2020 “Show Us Your BRAINS!” imaging contest. Because of the great potential of this next-generation technology, Translucence Biosystems has received Small Business Innovation Research grants from NIH’s National Institute of Mental Health to disseminate its “brain-clearing” imaging technology to the neuroscience community.
As more researchers try out this innovative approach, one can only imagine how much more data will be generated to enhance our understanding of how the brain functions in health and disease. That is what will be truly spectacular for everyone working on new and better ways to help people suffering from Alzheimer’s disease, Parkinson’s disease, schizophrenia, autism, epilepsy, traumatic brain injury, depression, and so many other neurological and psychiatric disorders.
Wishing all of you a happy and healthy July Fourth!
Links:
Brain Research Through Advancing Innovative Neurotechnologies® (BRAIN) Initiative (NIH)
NIH National Research Service Award
Medical Scientist Training Program (National Institute of General Medical Sciences/NIH)
Small Business Innovation Research and Small Business Technology Transfer (NIH)
Translucence Biosystems (Irvine, CA)
Sunil Gandhi (University of California, Irvine)
Ricardo Azevedo (University of California, Irvine)
Video: iDISCO-cleared whole brain from a Thy1-GFP mouse (Translucence Biosystems)
Show Us Your BRAINs! Photo & Video Contest (Brain Initiative/NIH)
NIH Support: National Institute of Mental Health; National Eye Institute
Finding Better Ways to Image the Retina
Posted on by Dr. Francis Collins
Every day, all around the world, eye care professionals are busy performing dilated eye exams. By looking through a patient’s widened pupil, they can view the retina—the postage stamp-sized tissue lining the back of the inner eye—and look for irregularities that may signal the development of vision loss.
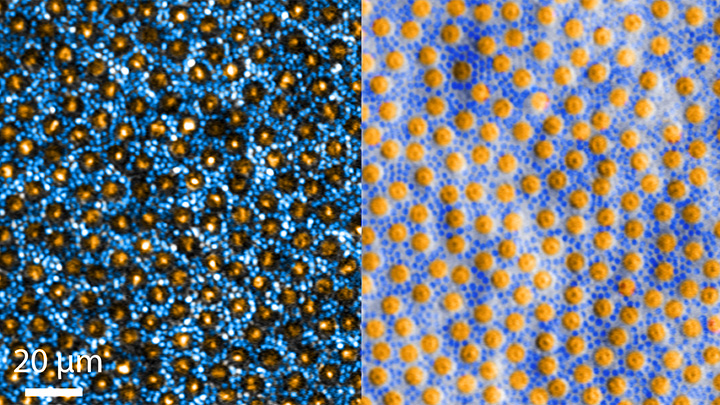
The great news is that, thanks to research, retinal imaging just keeps getting better and better. The images above, which show the same cells viewed with two different microscopic techniques, provide good examples of how tweaking existing approaches can significantly improve our ability to visualize the retina’s two types of light-sensitive neurons: rod and cone cells.
Specifically, these images show an area of the outer retina, which is the part of the tissue that’s observed during a dilated eye exam. Thanks to colorization and other techniques, a viewer can readily distinguish between the light-sensing, color-detecting cone cells (orange) and the much smaller, lowlight-sensing rod cells (blue).
These high-res images come from Johnny Tam, a researcher with NIH’s National Eye Institute. Working with Alfredo Dubra, Stanford University, Palo Alto, CA, Tam and his team figured out how to limit light distortion of the rod cells. The key was illuminating the eye using less light, provided as a halo instead of the usual solid, circular beam.
But the researchers’ solution hit a temporary snag when the halo reflected from the rods and cones created another undesirable ring of light. To block it out, Tam’s team introduced a tiny pinhole, called a sub-Airy disk. Along with use of adaptive optics technology [1] to correct for other distortions of light, the scientists were excited to see such a clear view of individual rods and cones. They published their findings recently in the journal Optica [2]
The resolution produced using these techniques is so much improved (33 percent better than with current methods) that it’s even possible to visualize the tiny inner segments of both rods and cones. In the cones, for example, these inner segments help direct light coming into the eye to other, photosensitive parts that absorb single photons of light. The light is then converted into electrical signals that stream to the brain’s visual centers in the occipital cortex, which makes it possible for us to experience vision.
Tam and team are currently working with physician-scientists in the NIH Clinical Center to image the retinas of people with a variety of retinal diseases, including age-related macular degeneration (AMD), a leading cause of vision loss in older adults. These research studies are ongoing, but offer hopeful possibilities for safe and non-intrusive monitoring of individual rods and cones over time, as well as across disease types. That’s obviously good news for patients. Plus it will help scientists understand how a rod or cone cell stops working, as well as more precisely test the effects of gene therapy and other experimental treatments aimed at restoring vision.
References:
[1] Noninvasive imaging of the human rod photoreceptor mosaic using a confocal adaptive optics scanning ophthalmoscope. Dubra A, Sulai Y, Norris JL, Cooper RF, Dubis AM, Williams DR, Carroll J. Biomed Opt Express. 2011 Jul 1;2(7):1864-76.
[1] In-vivo sub-diffraction adaptive optics imaging of photoreceptors in the human eye with annular pupil illumination and sub-Airy detection. Rongwen L, Aguilera N, Liu T, Liu J, Giannini JP, Li J, Bower AJ, Dubra A, Tam J. Optica 2021 8, 333-343. https://doi.org/10.1364/OPTICA.414206
Links:
Get a Dilated Eye Exam (National Eye Institute/NIH)
How the Eyes Work (NEI)
Eye Health Data and Statistics (NEI)
Tam Lab (NEI)
Dubra Lab (Stanford University, Palo Alto, CA)
NIH Support: National Eye Institute
On-the-Spot Gene Readouts Offer Clues to How Cells Work
Posted on by Dr. Francis Collins

Just as two companies can merge to expand their capabilities, two technologies can become more powerful when integrated into one. That’s why researchers recently merged two breakthrough technologies into one super powerful new method called ExSeq. The two-in-one technology enables researchers for the first time to study an intact tissue sample and track genetic activity on the spot within a cell’s tiniest recesses, or microenvironments—areas that have been largely out of reach until now.
ExSeq, which is described in a paper in the journal Science [1], will unleash many new experimental applications. Beyond enabling more precise analysis of the basic building blocks of life, these applications include analyzing tumor biopsies more comprehensively and even unlocking mysteries of how the brain works. The latter use is on display in this colorful cross-section of a mouse’s hippocampus, a region of the brain involved in the memory of facts and events.
Here you can see in precise and unprecedented detail the areas where genes are activated (magenta) in the brain’s neurons (green). In this particular example, the genes are working within subregions of the hippocampus called the CA1 and dentate gyrus regions (white, bottom and top left).
ExSeq is a joint effort from NIH grantees Ed Boyden, Massachusetts Institute of Technology (MIT), Cambridge, and George Church, Harvard Medical School, Boston. The new method combines a technology called tissue expansion with an in situ sequencing approach.
Tissue expansion swells the contents of tissue sections up to 100 times their normal size but retains their same physical structure [2]. It’s sort of like increasing the font size and line spacing on a hard-to-read document. It makes cellular details that were outside the resolution range of the light microscope suddenly accessible.
With the information inside cells now easier to see, the next step involves a technique called FISSEQ (fluorescent in situ sequencing), which generates readouts of thousands of mRNA molecules in cells [3]. FISSEQ works by detecting individual RNA molecules where they are inside cells and amplifying them into “nanoballs,” or rolled-up copies of themselves. Each nanoball can be read using standard sequencing methods and a fluorescence microscope.
Using the combined ExSeq approach, the team can analyze precisely where gene activity changes within tiny cellular microenvironments. Or, it can compile a more-comprehensive readout of gene activity within cells by analyzing as many gene readouts as detectable. When used in the hippocampus, this untargeted, “agnostic” approach led to some surprises—revealing unusual forms of RNA and, by association, genes for proteins not previously linked with communication between neurons.
Like many technology developments, the scientists envision that ExSeq can be used in many ways, including for more precise analysis of tumor biopsies. To illustrate this point, the researchers analyzed breast cancer metastases, which are cells from breast tumors that have spread to other areas in the body. Metastases contain many different cell types, including cancer cells and immune cells.
Using ExSeq, Boyden and Church learned that these distinct cell types can behave differently depending on where they are inside a tumor. They discovered, for example, that immune B cells near tumor cells expressed certain inflammatory genes at a higher level than immune B cells that were further away. Precise information about a tumor’s composition and activity may lead to development of more targeted approaches to attack it.
Many discoveries come on the heels of transformative new technologies. ExSeq shines a much brighter light on the world of the very small. And that should help us better understand how different parts of cells work together, as well as how cells work with each other in the brain, in cancer, and throughout the body.
References:
[1] Expansion sequencing: Spatially precise in situ transcriptomics in intact biological systems. Alon S, Goodwin DR, Sinha A, Wassie AT, et al. Science. 2021 Jan 29;37:eaax2656.
[2] Expansion microscopy. Chen F, Tillberg PW, Boyden ES. Science. 2015;347:543-548.
[3]. Highly multiplexed subcellular RNA sequencing in situ. Lee JH, Daugharthy ER, Scheiman J, Kalhor R, et al. Science. 2014;343:1360-1363.
Links:
Ribonucleic Acid (RNA) (National Human Genome Research Institute/NIH)
Synthetic Neurobiology Group (Massachusetts Institute of Technology, Cambridge)
George Church (Harvard Medical School, Boston)
NIH Support: National Human Genome Research Institute; National Cancer Institute; National Institute of Biomedical Imaging and Bioengineering; National Institute of Mental Health; National Institute of Neurological Disorders and Stroke
Previous Page Next Page